With Weighted Score and Net Intent covered in our previous blogs, we’re rounding out the Score More series with Percent Favorable.
Percent Favorable gives you the percent of positive responses that you receive. It’s similar to Net Intent – except it doesn’t subtract the negative responses from the positive responses. With Percent Favorable, you can find out just how positively your participants view your organization.
Percent Favorable in Use
When
Let’s say you work for a non-profit organization that wants to gauge how their donors and the public view the organization. After sending out a survey with Rating Questions regarding various aspects of your non-profit, it’s time to report on your findings.
Why
Percent Favorable can see the percent of positive responses overall, per question, or in question groups. This customization allows you to present the data in the way that’s most meaningful to you and your stakeholders.
How
You can display Percent Favorable in the Omni Report. To do this, click Score at the top of the Omni Report. Once the new page pops up, change the Score Type from Weighted Score to Percent Favorable.
Click the Options wheel next to the dropdown to choose which scores are considered positive responses. For my case, I’ll leave it at the default setting of 4 and 5 being positive for each question.
Next up is choosing how the score will be calculated and which rating questions to include in the calculation. Since I want to see how people view the non-profit in general, I’ll opt for Overall Score and include all questions.
Then, I click save, and my Percent Favorable score appears at the top of the Omni Report.
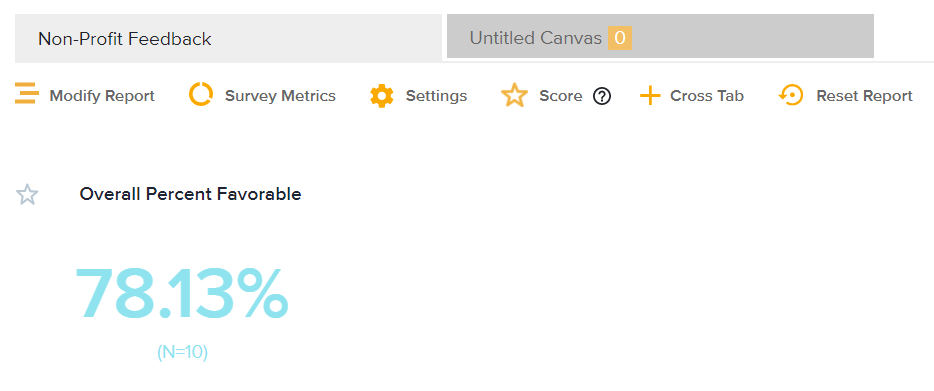
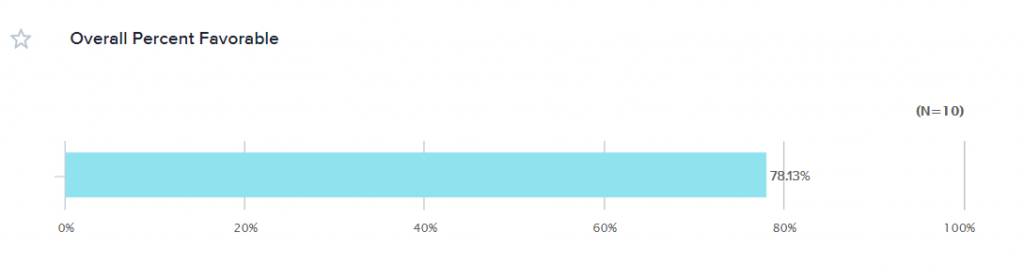
It defaults to a single percentage, as seen above, but I can choose to display it as a graph as well.
Other Views
If the plain old percentage by itself doesn’t do it for you, have no fear. There are others ways you can break down Percent Favorable.
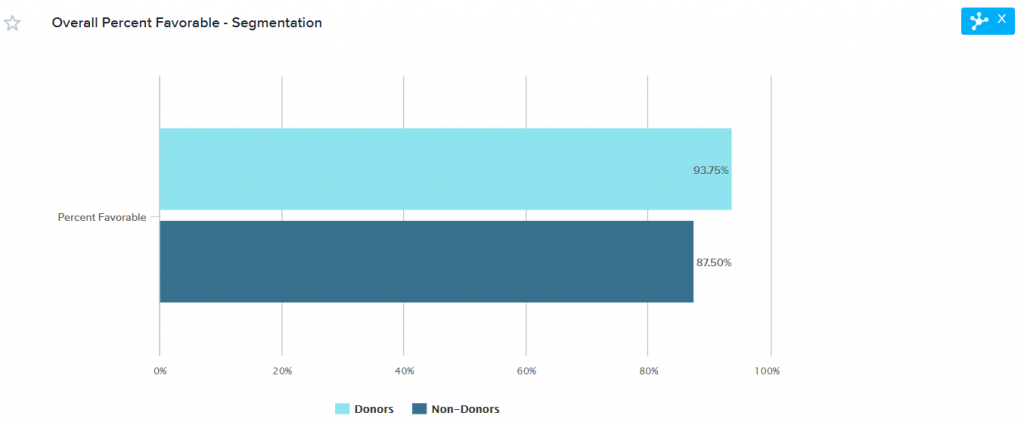
Filtering and Segmentation
If I only want to see how donors responded, I could apply a donor filter. If I want to compare the responses of donors to those of non-donors, I would use segmentation.
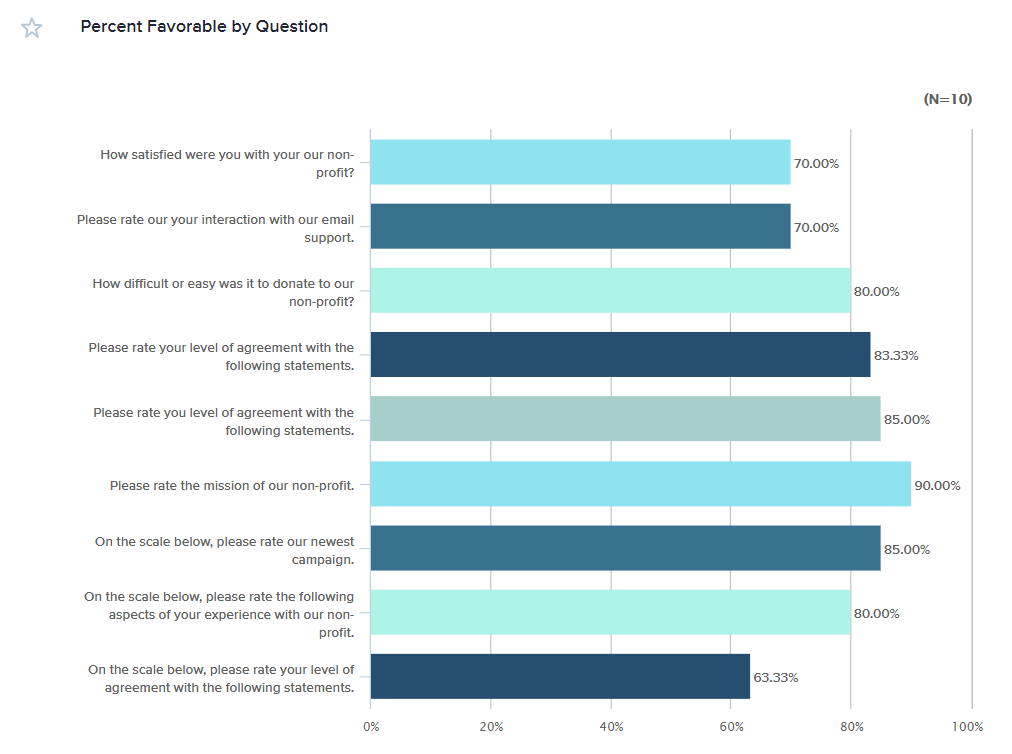
Alternate Calculations
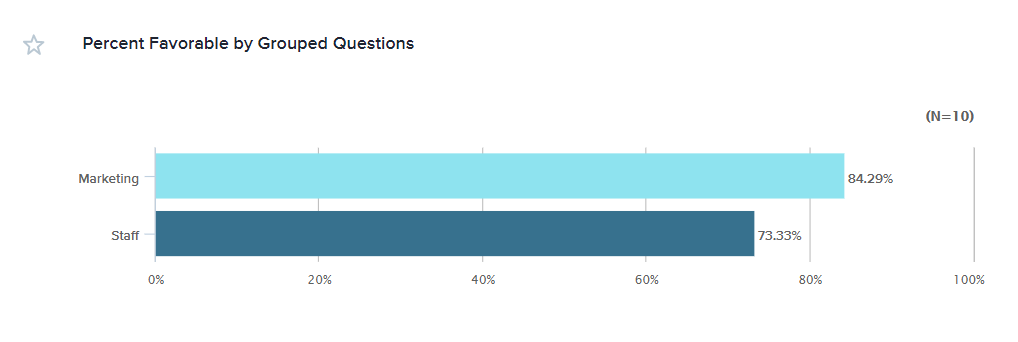
You can also change how your Percent Favorable is calculated. Instead of Overall Score, it can be calculated as Question Scores or Grouped Question Scores. If I want to see the Percent Favorable score for each individual question, I would calculate by Question Scores.
Grouped Question Scores is used to see the Percent Favorable score of one group of questions to another group of question’s score. For example, I might want to all the questions related to our company’s marketing compared to the questions related to our customer facing team.
Still have questions?
The Score Move series is over, but we’re still here to help you make the most of your projects. If you’re still unsure about how to use scoring in your project, check out our User Guide page on Scoring, join a reports training session, or reach out to support within your account.