CX Dashboard: Maps
The Maps tab turns your customer feedback into a geographic, colour-coded map. Instead of a single global score, you can see how a metric performs region by region — which countries, states, and counties are doing well and which need attention — all from the same response data that already feeds your CX Dashboard.
With Maps you can:
- View any core CX metric (NPS, CSAT, CES) or a custom metric as a colour-coded map.
- Drill down through several geographic levels, from World down to ZIP/Postal Code.
- Click a region to see its score, response count, and full breakdown — along with its sentiment score, top themes, and top emotions.
- Control how each response is placed on the map — by IP address, tags, or directory and activity fields — in Map Settings.
Navigate to
- Where to Find Maps
- Reading the Map
- Metrics & Colour Bands
- Map Settings — How Feedback Is Placed on the Map
Where to Find Maps
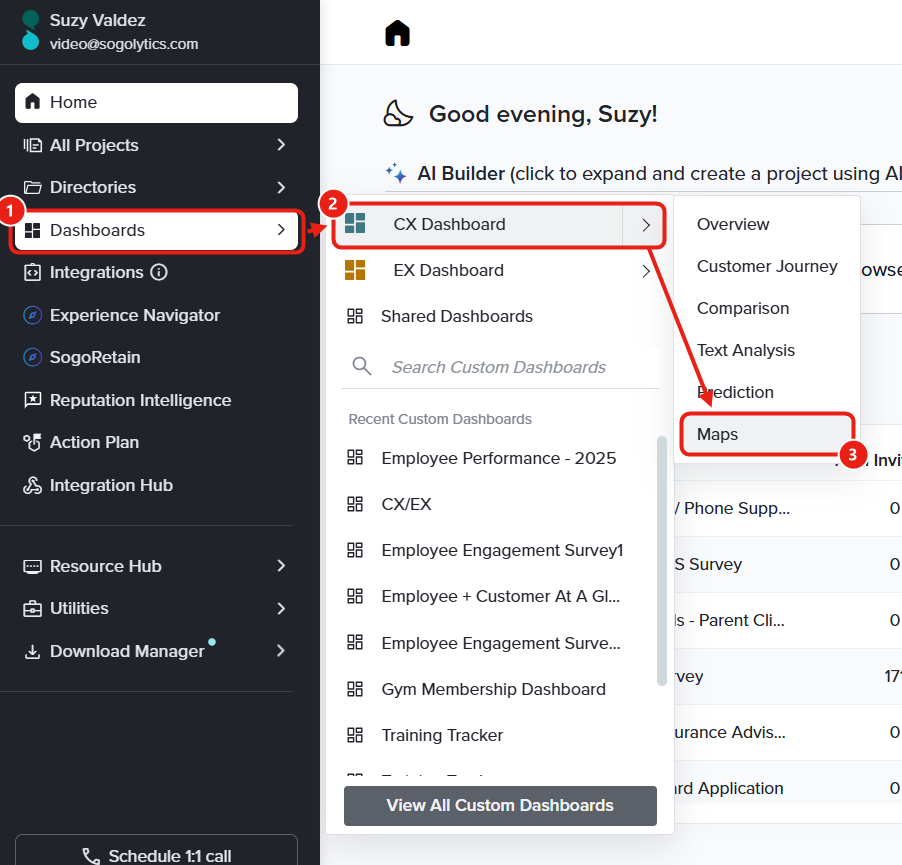
On the Home page, open the left-hand menu and click Dashboards → CX Dashboard → Maps.
When Maps opens, the default view is data-driven: the map opens at the broadest level that contains your responses. If all of your responses so far come from a single location — say, the United States — Maps opens zoomed to the US rather than to the full world.
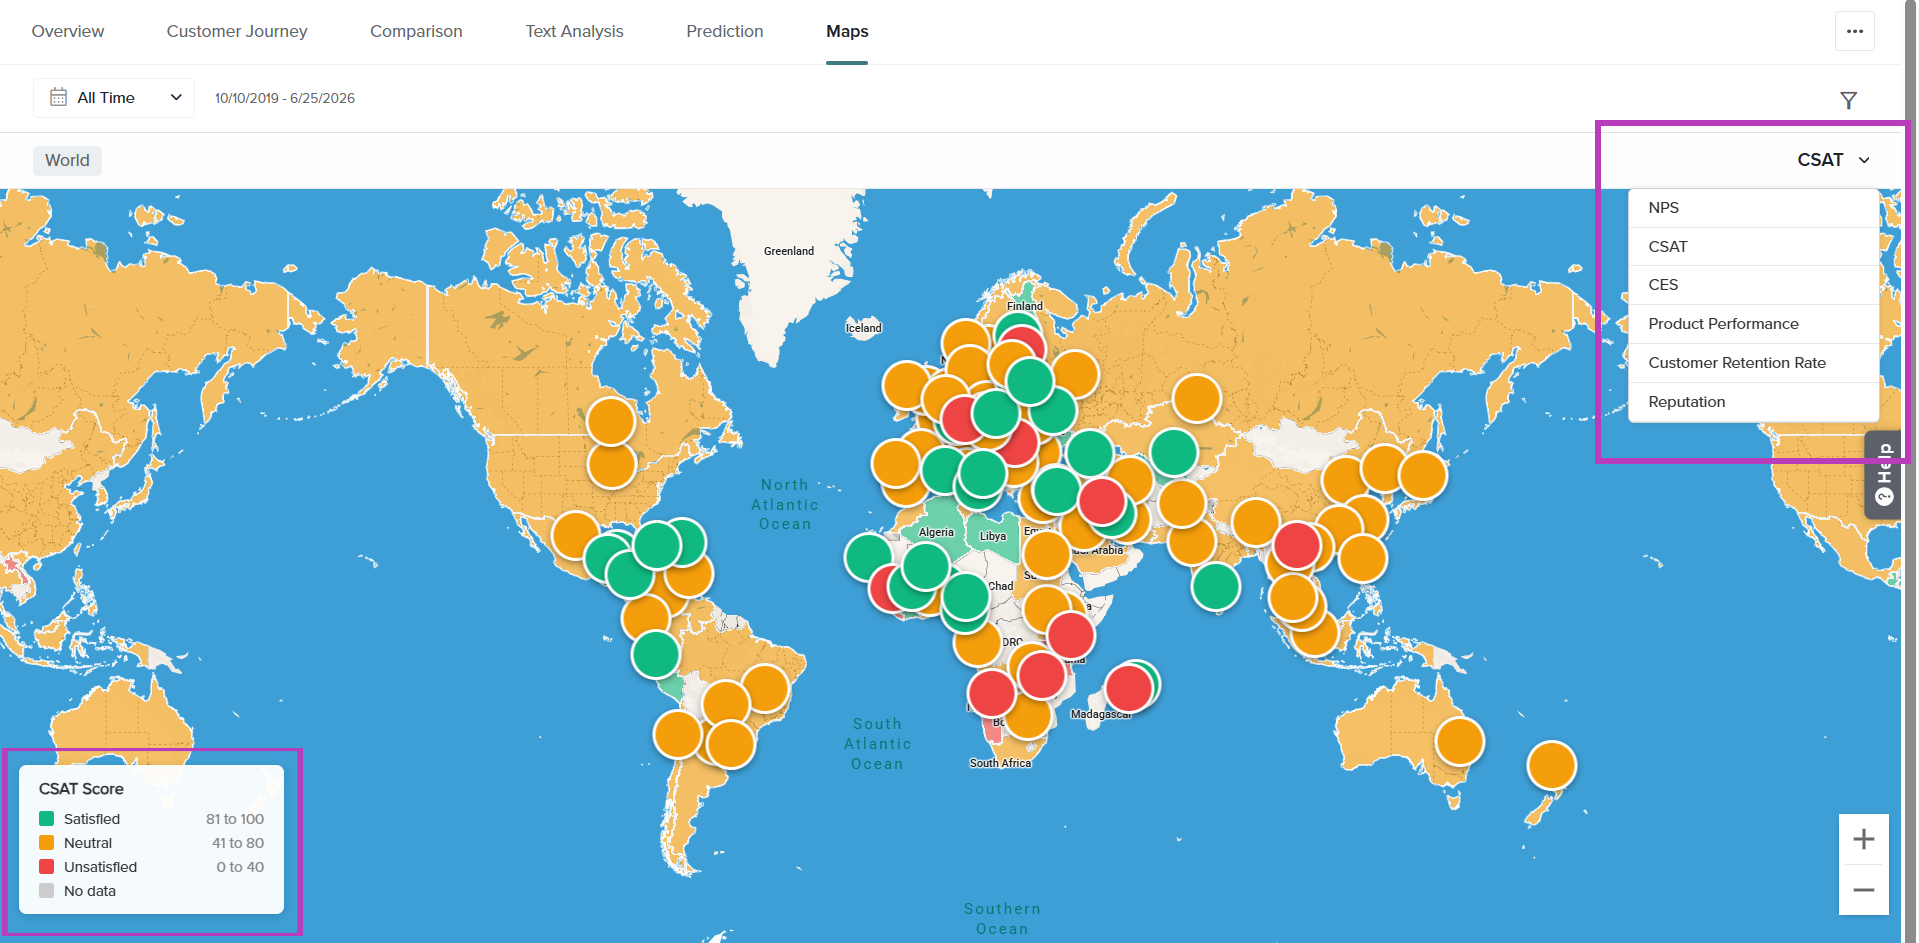
Reading the Map
The Map Canvas
- Each region is shaded by its score for the selected metric, using the three-band legend (Red, Orange and Green).
- Regions with no responses are left unshaded (neutral grey).
- Zoom in or out using the + and − controls in the bottom-right corner, your mouse wheel, or trackpad pinch gestures.
- Click and drag to pan horizontally and explore additional locations.
- Hover over a location to see its metric score, sentiment, themes, and emotions.
To view Sentiment Analysis, the AI-Driven Text Analysis Report must be enabled for your account. Additionally, sentiment analysis is performed only on survey questions designated as Follow-up questions.
Region Details on Hover
Hovering over a region displays the following details of the current location:
- The region name and response count.
- The metric score and the distribution of that score.
- The sentiment score, top themes, and top emotions.
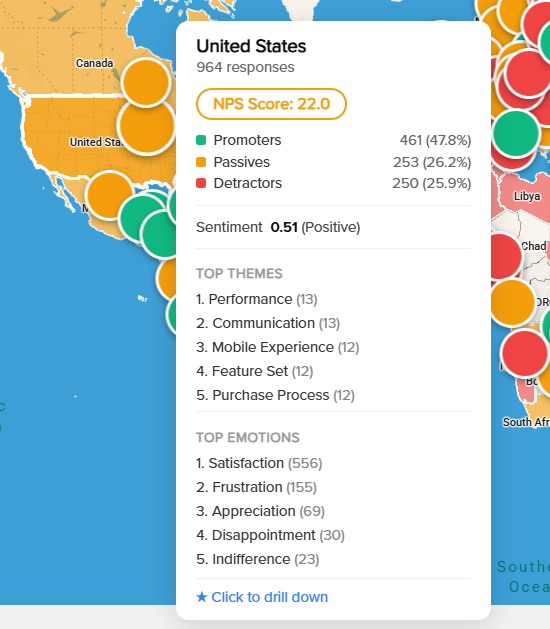
With NPS selected, click United States to view the following details:
- Response Count: 964
- NPS Score: 22.0
- Promoters: 461 (47.8%)
- Passives: 253 (26.2%)
- Detractors: 250 (25.9%)
- Sentiment: 0.51 (Positive)
- Top Theme: Performance (13)
- Top Emotion: Satisfaction (556)
Drilling down through geographic levels
- The map drills down as far as the available location data allows, through these levels: World → Country → State → County → ZIP/Postal Code.
- Each click drills one level deeper, and the breadcrumb at the top of the map updates (for example, World > United States of America > California).
- Use the breadcrumb to move back up to any higher level.
- When you reach a level with no deeper data, the card stops showing the “click to drill down” message.
Metrics & Colour Bands
Choose the metric from the selector at the top-right of the map. The legend and the breakdown both change to match the selected metric. The map always uses the same colour logic: red = lowest band, Orange = middle band, green = highest band.
| Metric | Score Range Bands | Category Break Down |
| NPS (Net Promoter Score) | −100 to 0, 1 to 30, 31 to 100 | Promoters, Passives, Detractors |
| CSAT (Customer Satisfaction) | (0–50)%, (51–75)%, (76–100)% | Satisfied, Neutral, Unsatisfied |
| CES (Customer Effort Score) | 1 to 3, 4 to 5, 6 to 7 | Low, Moderate, High (7-point) |
| Custom metrics (e.g., Product Performance, Customer Retention Rate, Reputation) | Bands follow the metric’s own scale | The metric’s own scale points |
Custom metrics appear in the selector automatically once they are configured for the dashboard, and the map uses each metric’s own scale and answer labels.
Map Settings — How Responses Are Placed on the Map
By default, Maps determines a respondent’s location using the IP address captured at the time the survey is submitted. Map Settings lets you customize how responses are placed on the map by allowing you to choose and prioritize the location source. In addition to IP address, you can map responses using another location identifier available in your data, giving you greater control over how locations are assigned. This is especially useful when IP address information is unavailable, inaccurate, or when your organization maintains reliable location data within its own systems.
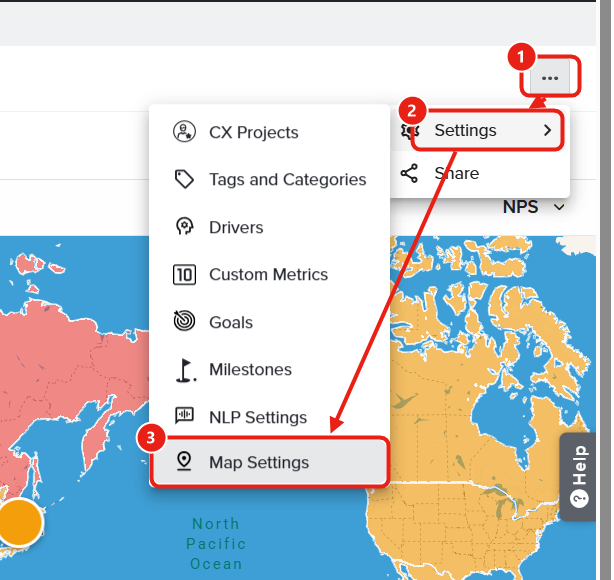
Adding Identifiers
- From your CX Dashboard, click the three-dot (…) menu at the top-right and select Settings.
- Select Map Settings from the Settings menu.
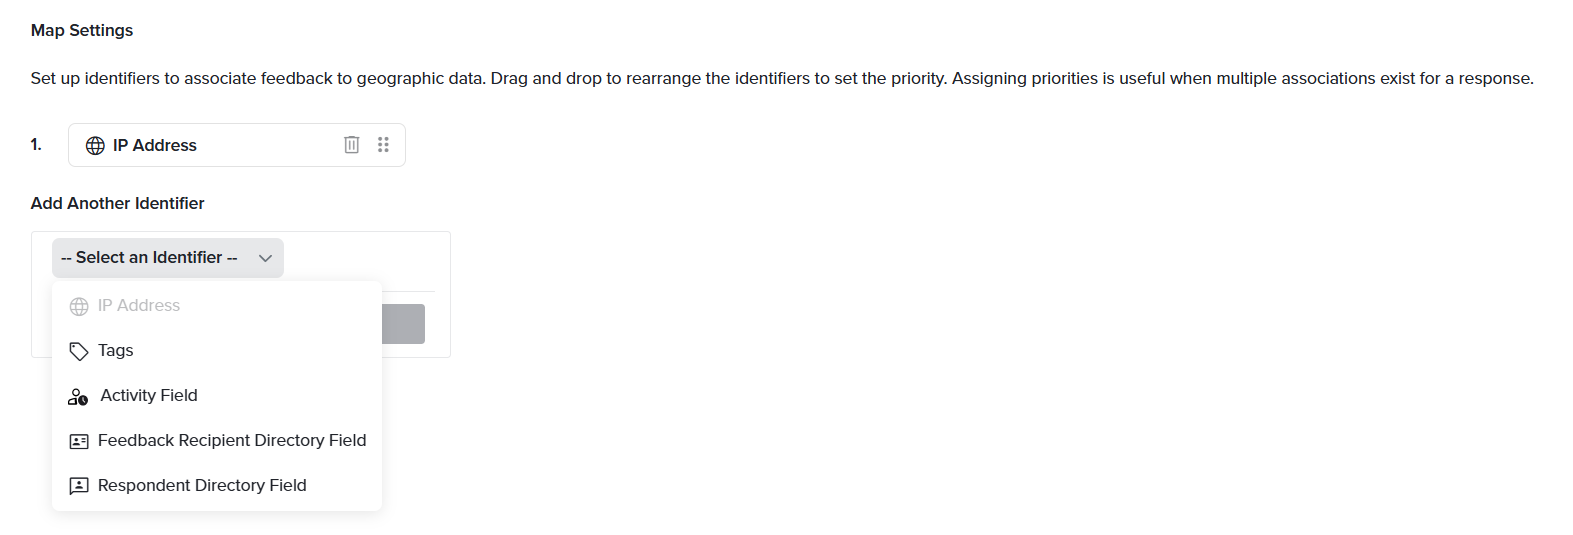
In Map Settings, you set up identifiers to associate feedback with geographic data. You can use the following identifier types for location assignment:
- IP Address: Automatically determines a respondent’s geographic location using the IP address captured at the time of response submission.
- Tags: Determines location from the tags applied to responses. See Using Tags as Identifiers below.
- Directory and Activity Fields: Derives location from a respondent or feedback recipient’s ’s directory profile, or from activity data fields that contain geographic information. See Using Directory and Activity Fields as Identifiers below.
You can select more than one method at a time.
When multiple methods are selected, you must define a preference order. If a response has location data from more than one method, the system uses whichever method ranks highest in your preference order.
Using Tags as Identifiers
When Tags is selected as a location method, the system matches tag values against a predefined list of supported location names. Only tags that match this list are used to assign responses to geographic areas.
To configure tag-based location assignment:
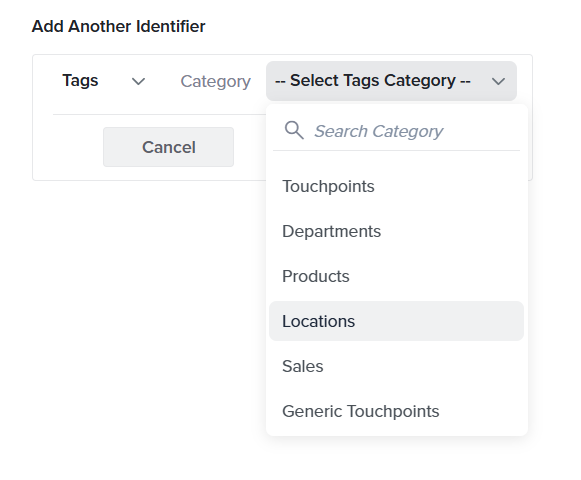
- In Map Settings, click + Add Another Identifier.
- Select Tags from the available identifiers.
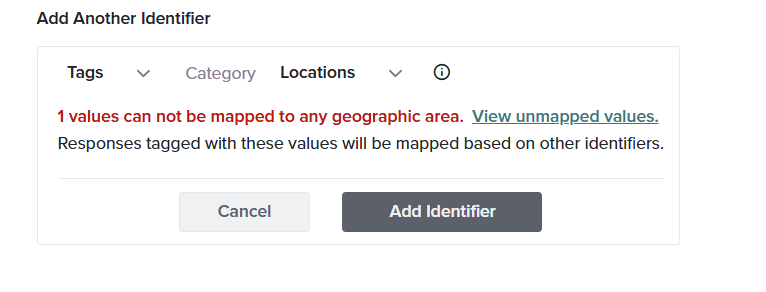
- Select the tag category that best represents your locations. The system evaluates the tags within the selected category and checks whether each tag value matches a recognized geographic location.
- If a tag value matches a recognized location, the associated responses are automatically mapped and will appear on the map once you click Add Identifier.
- If any tag values cannot be matched to a location, a View Unmapped Values link appears below the added identifier.
- Click View Unmapped Values and manually assign a location to each unmapped tag. As you begin typing, a list of suggested locations appears. Be sure to select a location from the suggested list.
- As valid locations are assigned, the corresponding tags are moved to the Manually Mapped Locations section.
- After all locations have been assigned, click Add Identifier. The map refreshes and displays data based on the updated mapping configuration.
Using Directory and Activity Fields as Identifiers
When using Respondent Directory Fields, Feedback Recipient Directory Fields, or Activity Fields as a location identifier, the system evaluates the selected field values and checks whether they match recognized geographic locations. Matching values are automatically mapped, while unmatched values can be manually assigned to locations.
To configure location assignment using directory or activity fields:
- In Map Settings, click + Add Another Identifier.
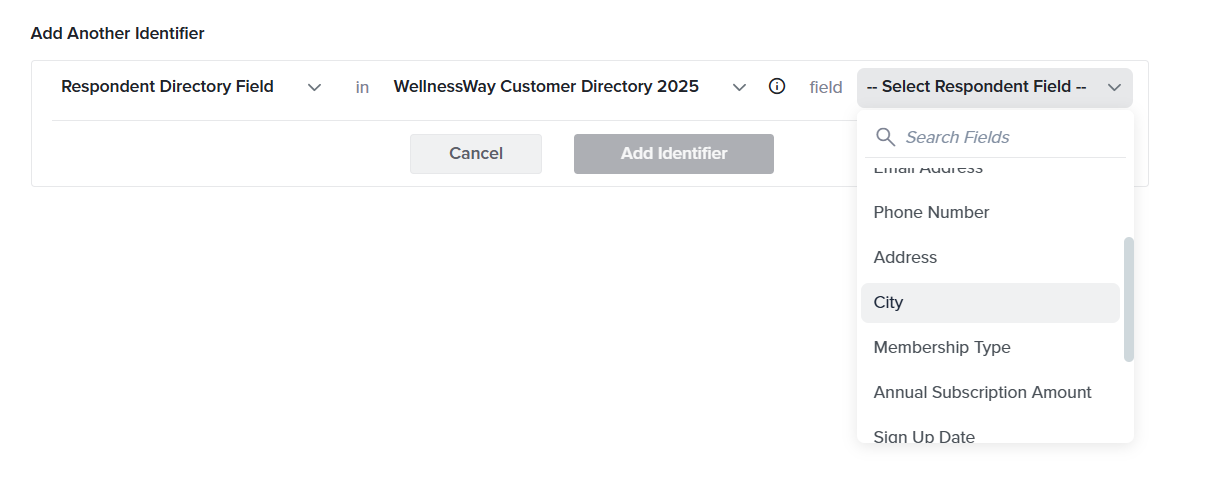
- Select Respondent Directory Field, Feedback Recipient Directory Field, or Activity Field from the available identifiers.
- Select the field that best represents your locations. The system evaluates the values in the selected field and checks whether each value matches a recognized geographic location.
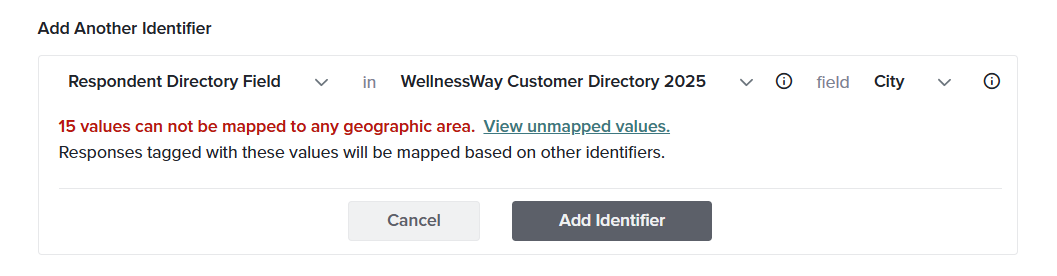
- If a field value matches a recognized location, the associated responses are automatically mapped and will appear on the map once you click Add Identifier.
- If any field values cannot be matched to a location, a View Unmapped Values link appears below the added identifier.
- Click View Unmapped Values and manually assign a location to each unmapped value. As you begin typing, a list of suggested locations appears. Be sure to select a location from the suggested list.
- As valid locations are assigned, the corresponding values are moved to the Manually Mapped Locations section.
- After all locations have been assigned, click Add Identifier. The map refreshes and displays data based on the updated mapping configuration.
Subscribe for tips and insights to drive better decisions!