
Experience Navigator
Experience Navigator turns a business objective into a working experience program. Instead of assembling a strategy piece by piece — deciding which touchpoints (the moments at which a customer or an employee interacts with your organization) matter, which metrics prove progress, and which surveys to field — you select a focus and Experience Navigator generates the strategy and the projects that measure it, configured in your account and ready to launch.
With Experience Navigator you can:
- Select a business objective from a curated list or enter a custom objective specific to your organization.
- Generate a complete strategy document covering the reasoning behind every recommendation.
- Review the customer or employee touchpoints mapped to your objective, along with the pain points — the friction identified at each touchpoint — that go with them.
- See the key metrics aligned to your objective, such as Net Promoter Score (NPS), Customer Satisfaction Score (CSAT), or engagement drivers.
- Launch pre-configured projects into your account and begin collecting responses without building surveys from scratch.
Navigate to
- Where to Find Experience Navigator
- How Experience Navigator Works
- Choosing Your Focus
- What Experience Navigator Generates
- Reviewing Your Strategy
- Understanding Touchpoints and Pain Points
- Launching Your Recommended Projects
- Where Your Strategy Appears After Launch
Where to Find Experience Navigator
Experience Navigator is available from the left-hand menu on Home, alongside the other account-level areas of the platform.
- Log in to your Sogolytics account. In the left-hand menu, select Experience Navigator.
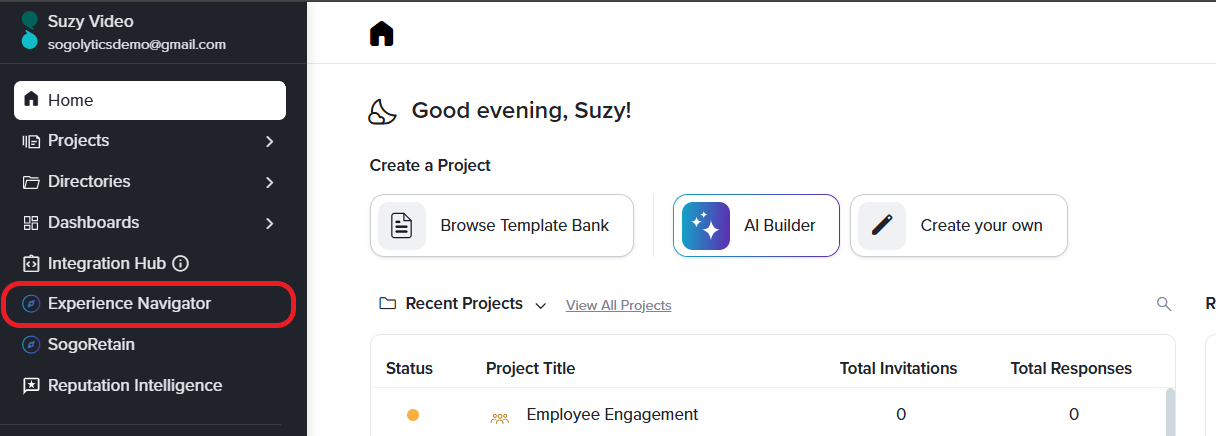
- Read the introduction. It explains what Experience Navigator produces and lists the four principles the generated strategy follows:
- Personalized, customized to your business model and goals
- Data-Driven, built on key metrics relevant to your industry and vertical
- Efficient, optimized to engage users at the right time through the right channels
- Impactful, aligned with actionable objectives that close feedback loops.
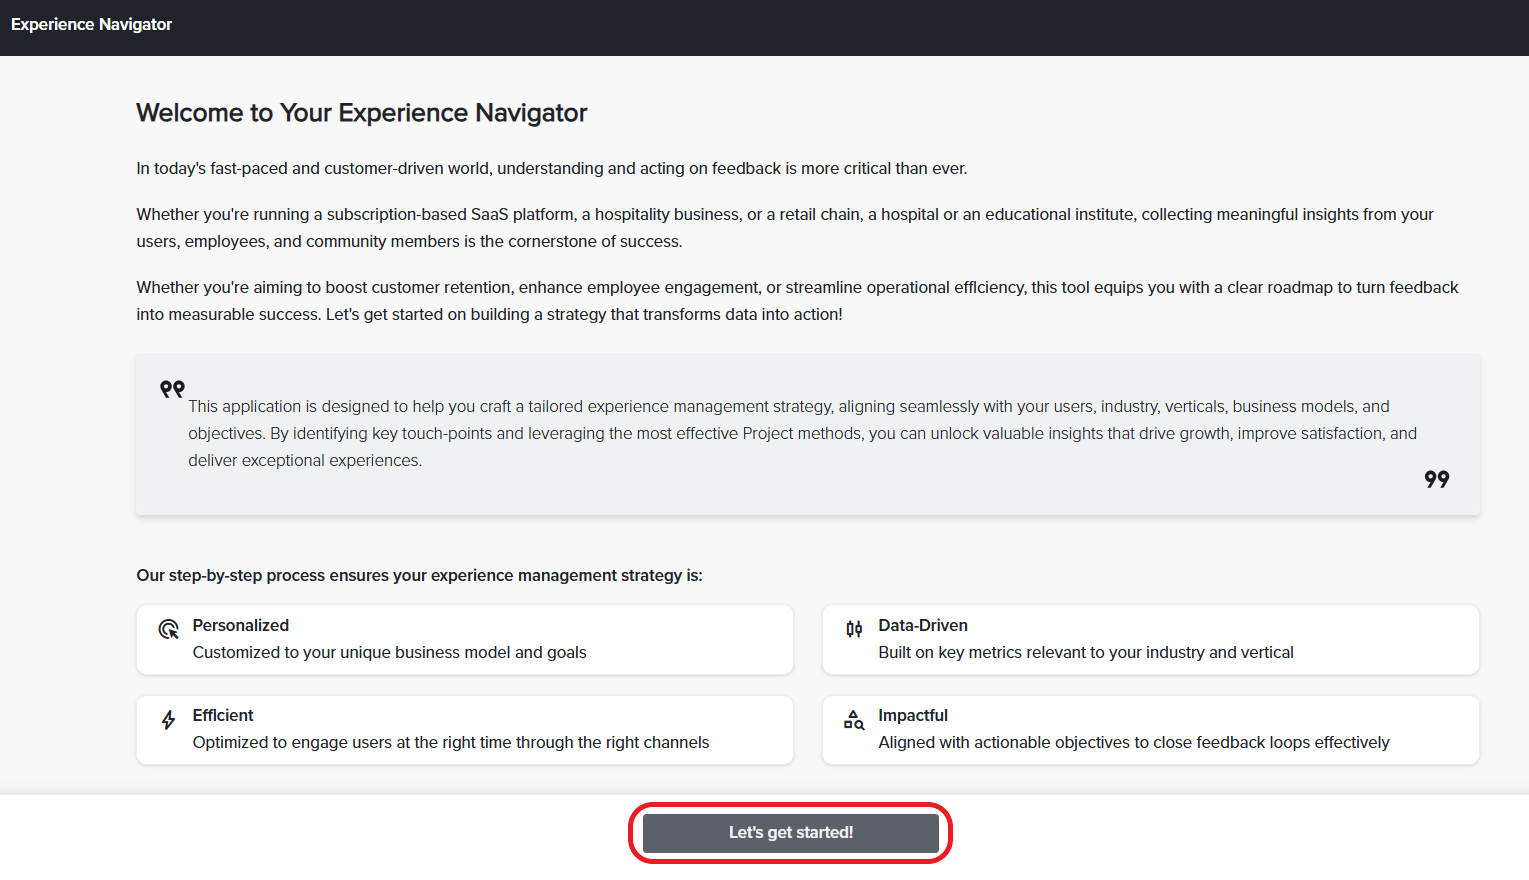
- Select Let’s get started! at the bottom of the page to begin building your strategy.
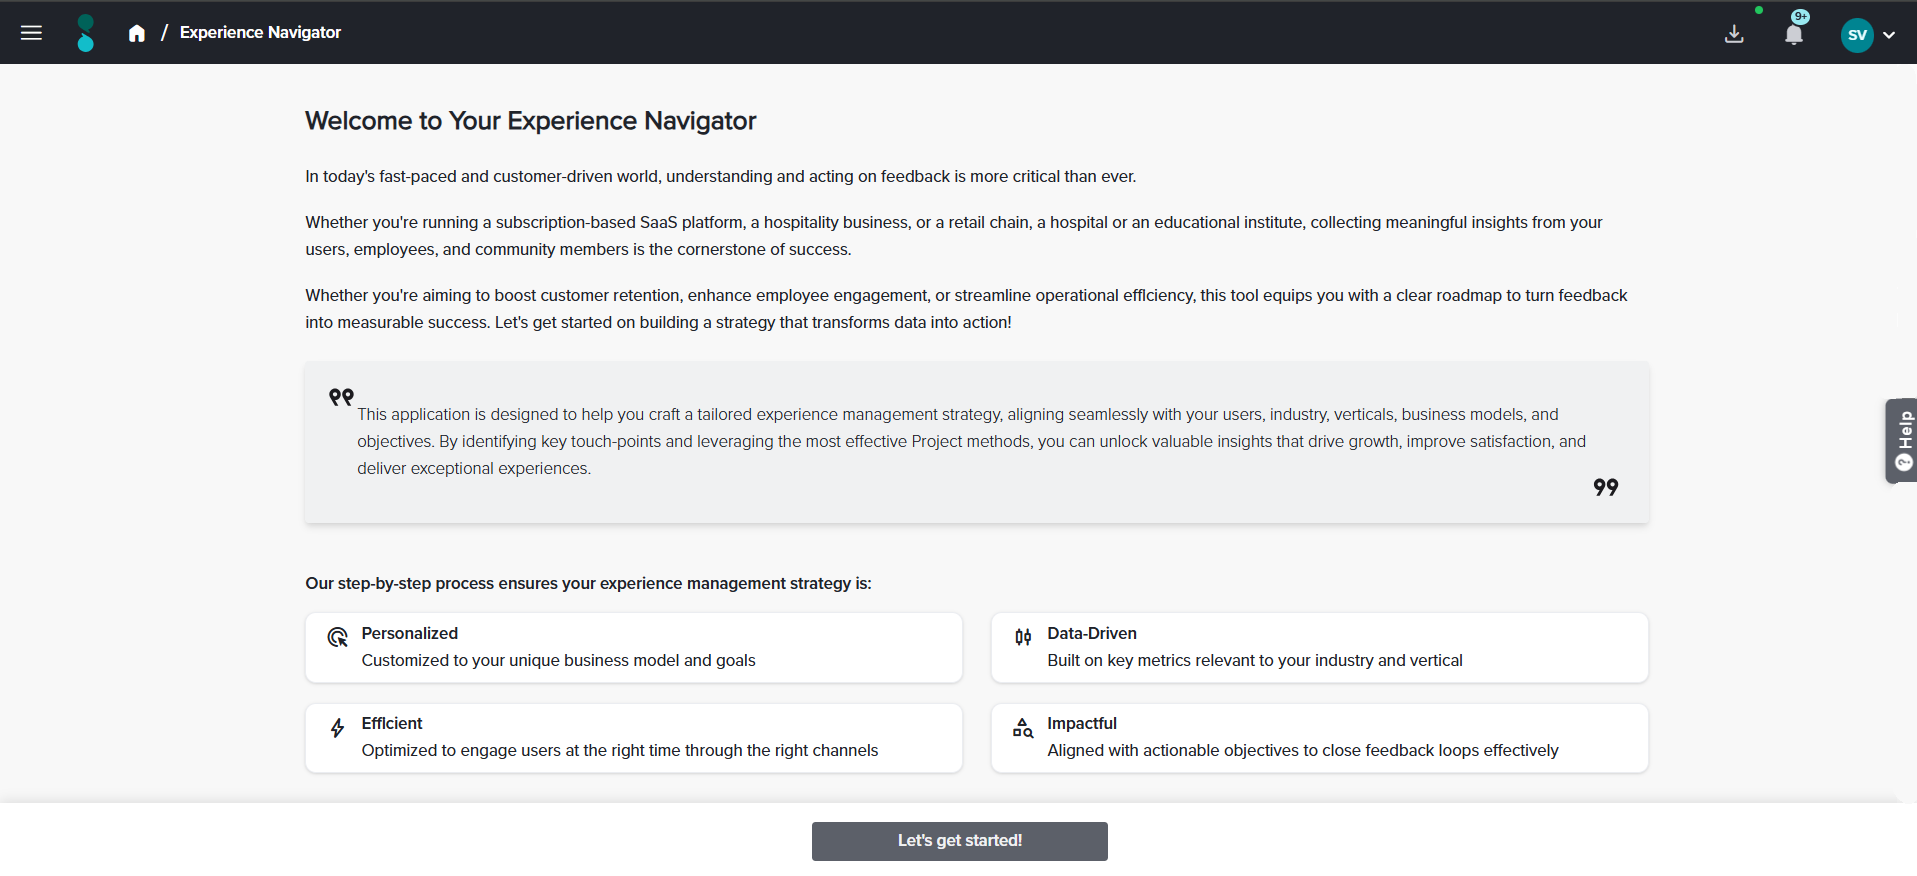
Navigation path: Home → Experience Navigator → Let’s get started!
Brightside is an online clothing shop. It attracts plenty of first-time buyers, but around half of them never place a second order, and nobody at the company can say why.
Sam looks after customer experience at Brightside. Sam has no journey map, no measurement of any individual step in the buying process, and no budget for consultants — only a question from the board: what is putting first-time customers off? Sam logs in, selects Experience Navigator from the left-hand menu on Home, reads the welcome page, and selects Let’s get started!
This example follows Sam through the rest of the article. The shop and the characters are fictional, and used for explanation purposes only.
Good to know
- Experience Navigator opens as a full-page module, so the left-hand menu is replaced by the module top bar while you are inside it. The top bar shows the hamburger menu, the Home icon, and the Experience Navigator label on the left, with the download, notifications, and account icons on the right. To return to the rest of the platform, select the Home icon or open the hamburger menu.
- Availability depends on the Sogolytics subscription tier your account is on, which determines the features and limits available to you. If Experience Navigator does not appear in your left-hand menu, contact your account administrator or Sogolytics support.
How Experience Navigator Works
Experience Navigator runs in three stages. Most accounts complete all three in five to ten minutes.
- Choose your focus. You select the business objective the strategy should serve.
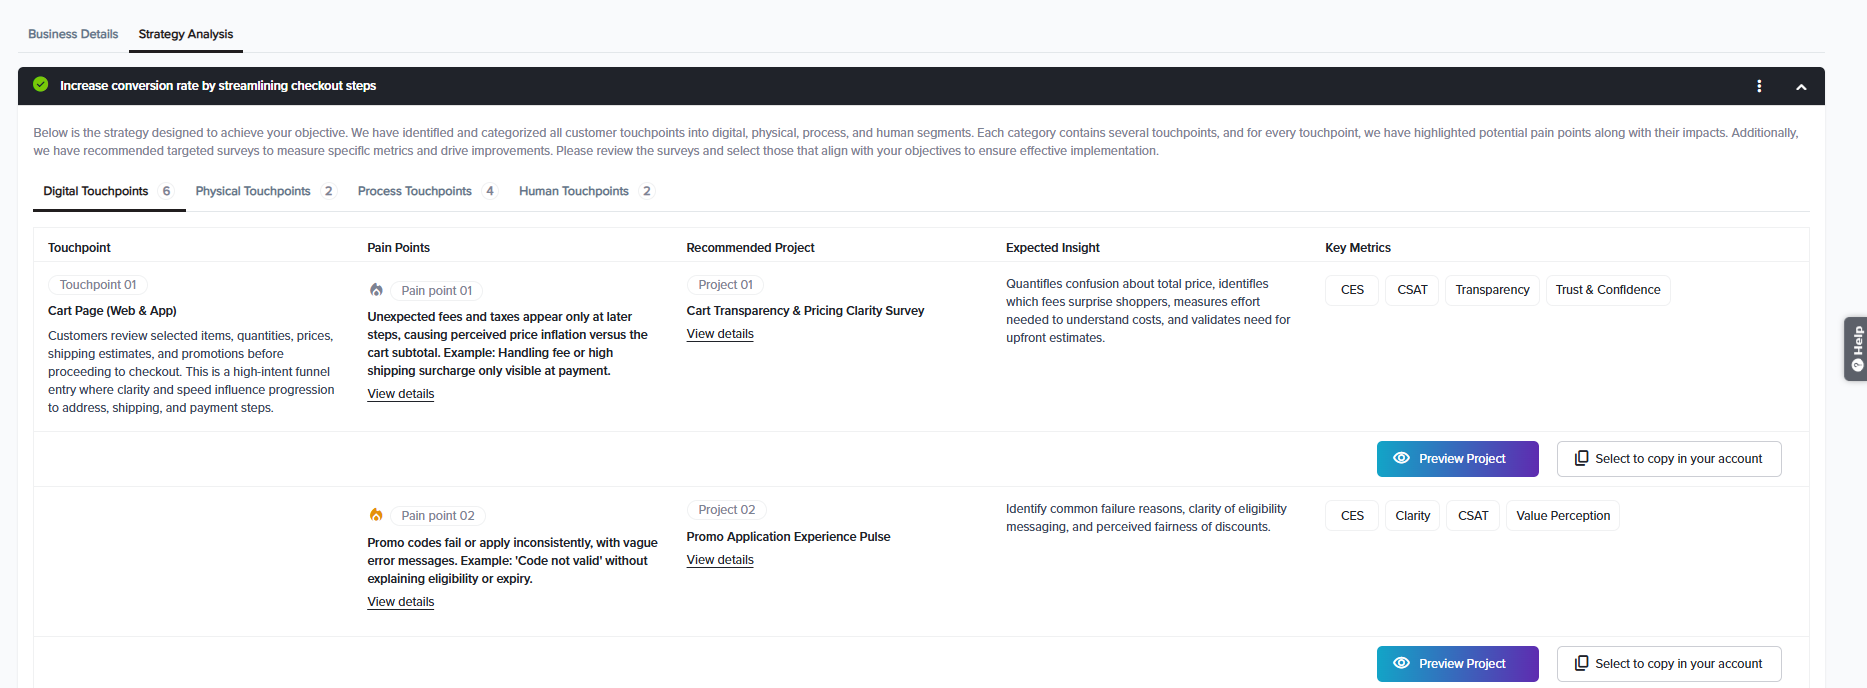
- Experience Navigator builds your playbook. The playbook is the complete set of outputs generated from your objective: touchpoints, pain points, metrics, recommended projects, and the insights each project is expected to produce.
- Launch with one click. The recommended projects are created in your account, fully configured and ready to field.
You review the generated strategy before anything is launched, so nothing is created in your account until you decide to proceed.
Choosing Your Focus
Everything Experience Navigator generates is derived from what you enter here; this is the stage that shapes the result. It runs as four steps, shown as a progress bar across the top of the page: Industry & Vertical → Business Model → Operational Scope → Objectives. Completed steps are marked with a green tick, and Back returns you to the previous step.
The four steps collect six pieces of information between them:
| Term | What it means |
| Strategy Type | Whether the strategy measures customer experience (CX) or employee experience (EX). This determines whose journey is mapped and which metrics apply. |
| Industry | The sector your organization operates in — for example, Retail. Industries differ in what people expect and in which metrics matter, so this sets the baseline for every recommendation. |
| Vertical | The narrower segment within your industry — for example, Ecommerce Marketplaces and Pure-Play Online Retail. The vertical sharpens the recommendations beyond the sector average. |
| Business Model | How you make money and deliver to your customers: who owns the stock, who ships it, and how you charge. Select every model you operate — many organizations run more than one. |
| Operational Scope | How you run day to day: where you fulfil from, how you deliver, and how you support customers. Select every scope that applies. |
| Objectives | The business outcomes you want the strategy to serve. Everything Experience Navigator recommends — touchpoints, metrics, and projects — is built to move these. |
- On the welcome page, select Let’s get started! The Industry & Vertical step opens.
- Under Strategy Type, select Customer Experience (CX) or Employee Experience (EX).
- Select your Industry from the dropdown, then your Vertical. The vertical list reflects the industry you chose.
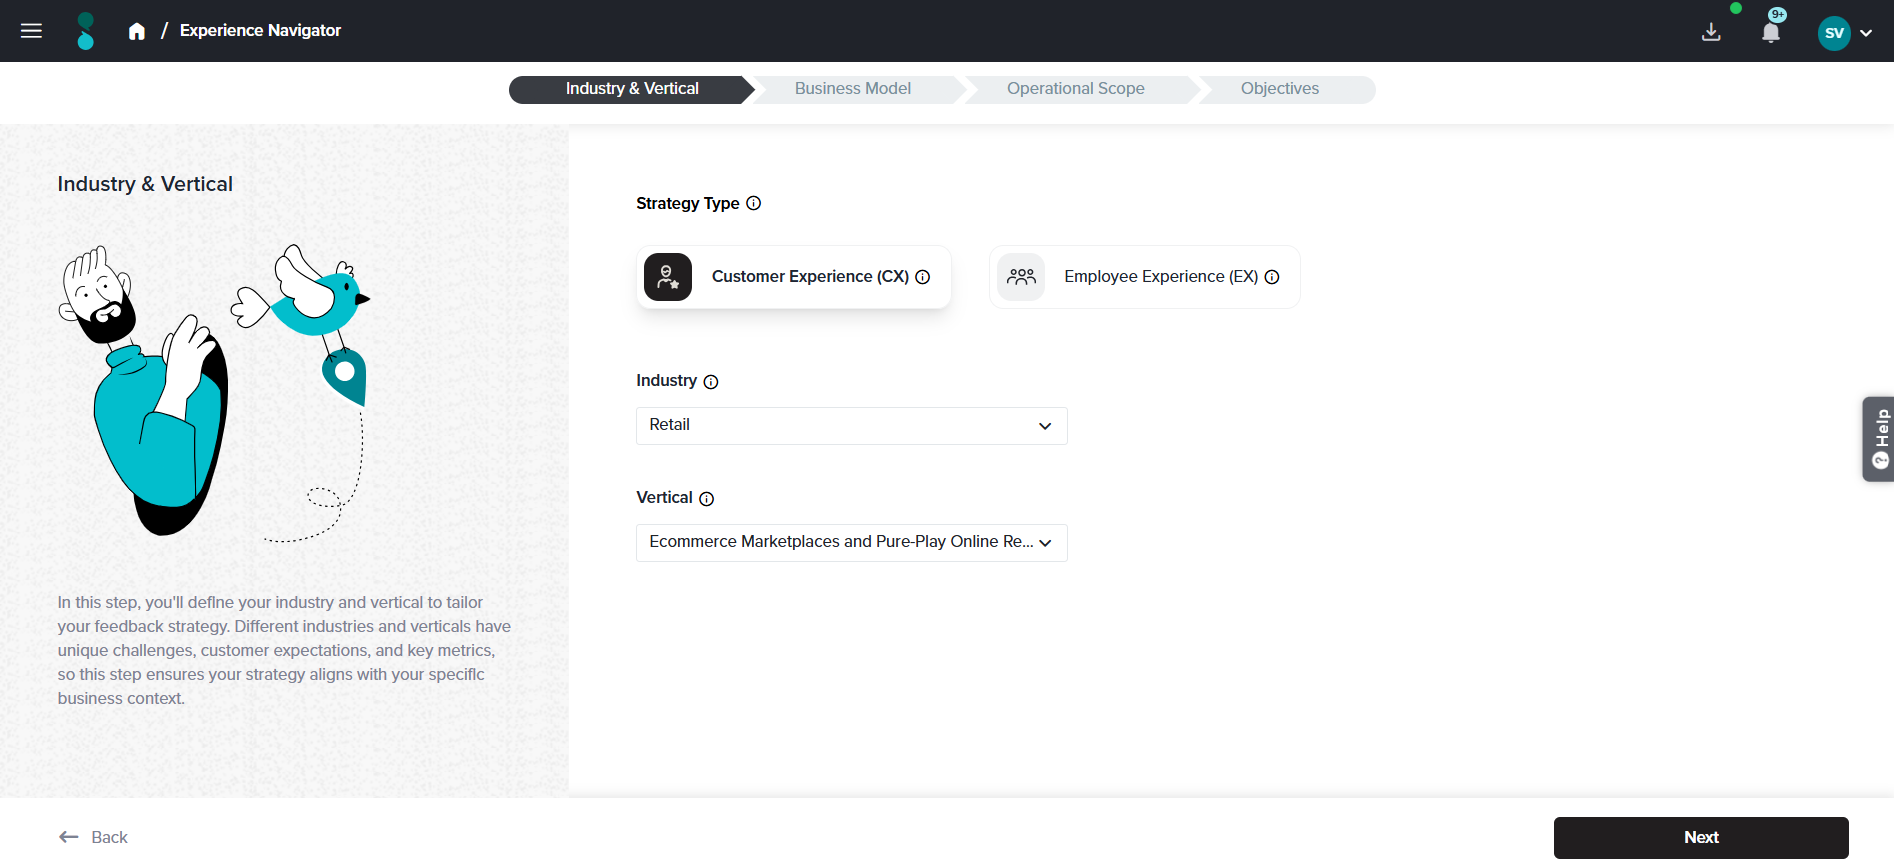
- Select Next. The Business Model step opens.
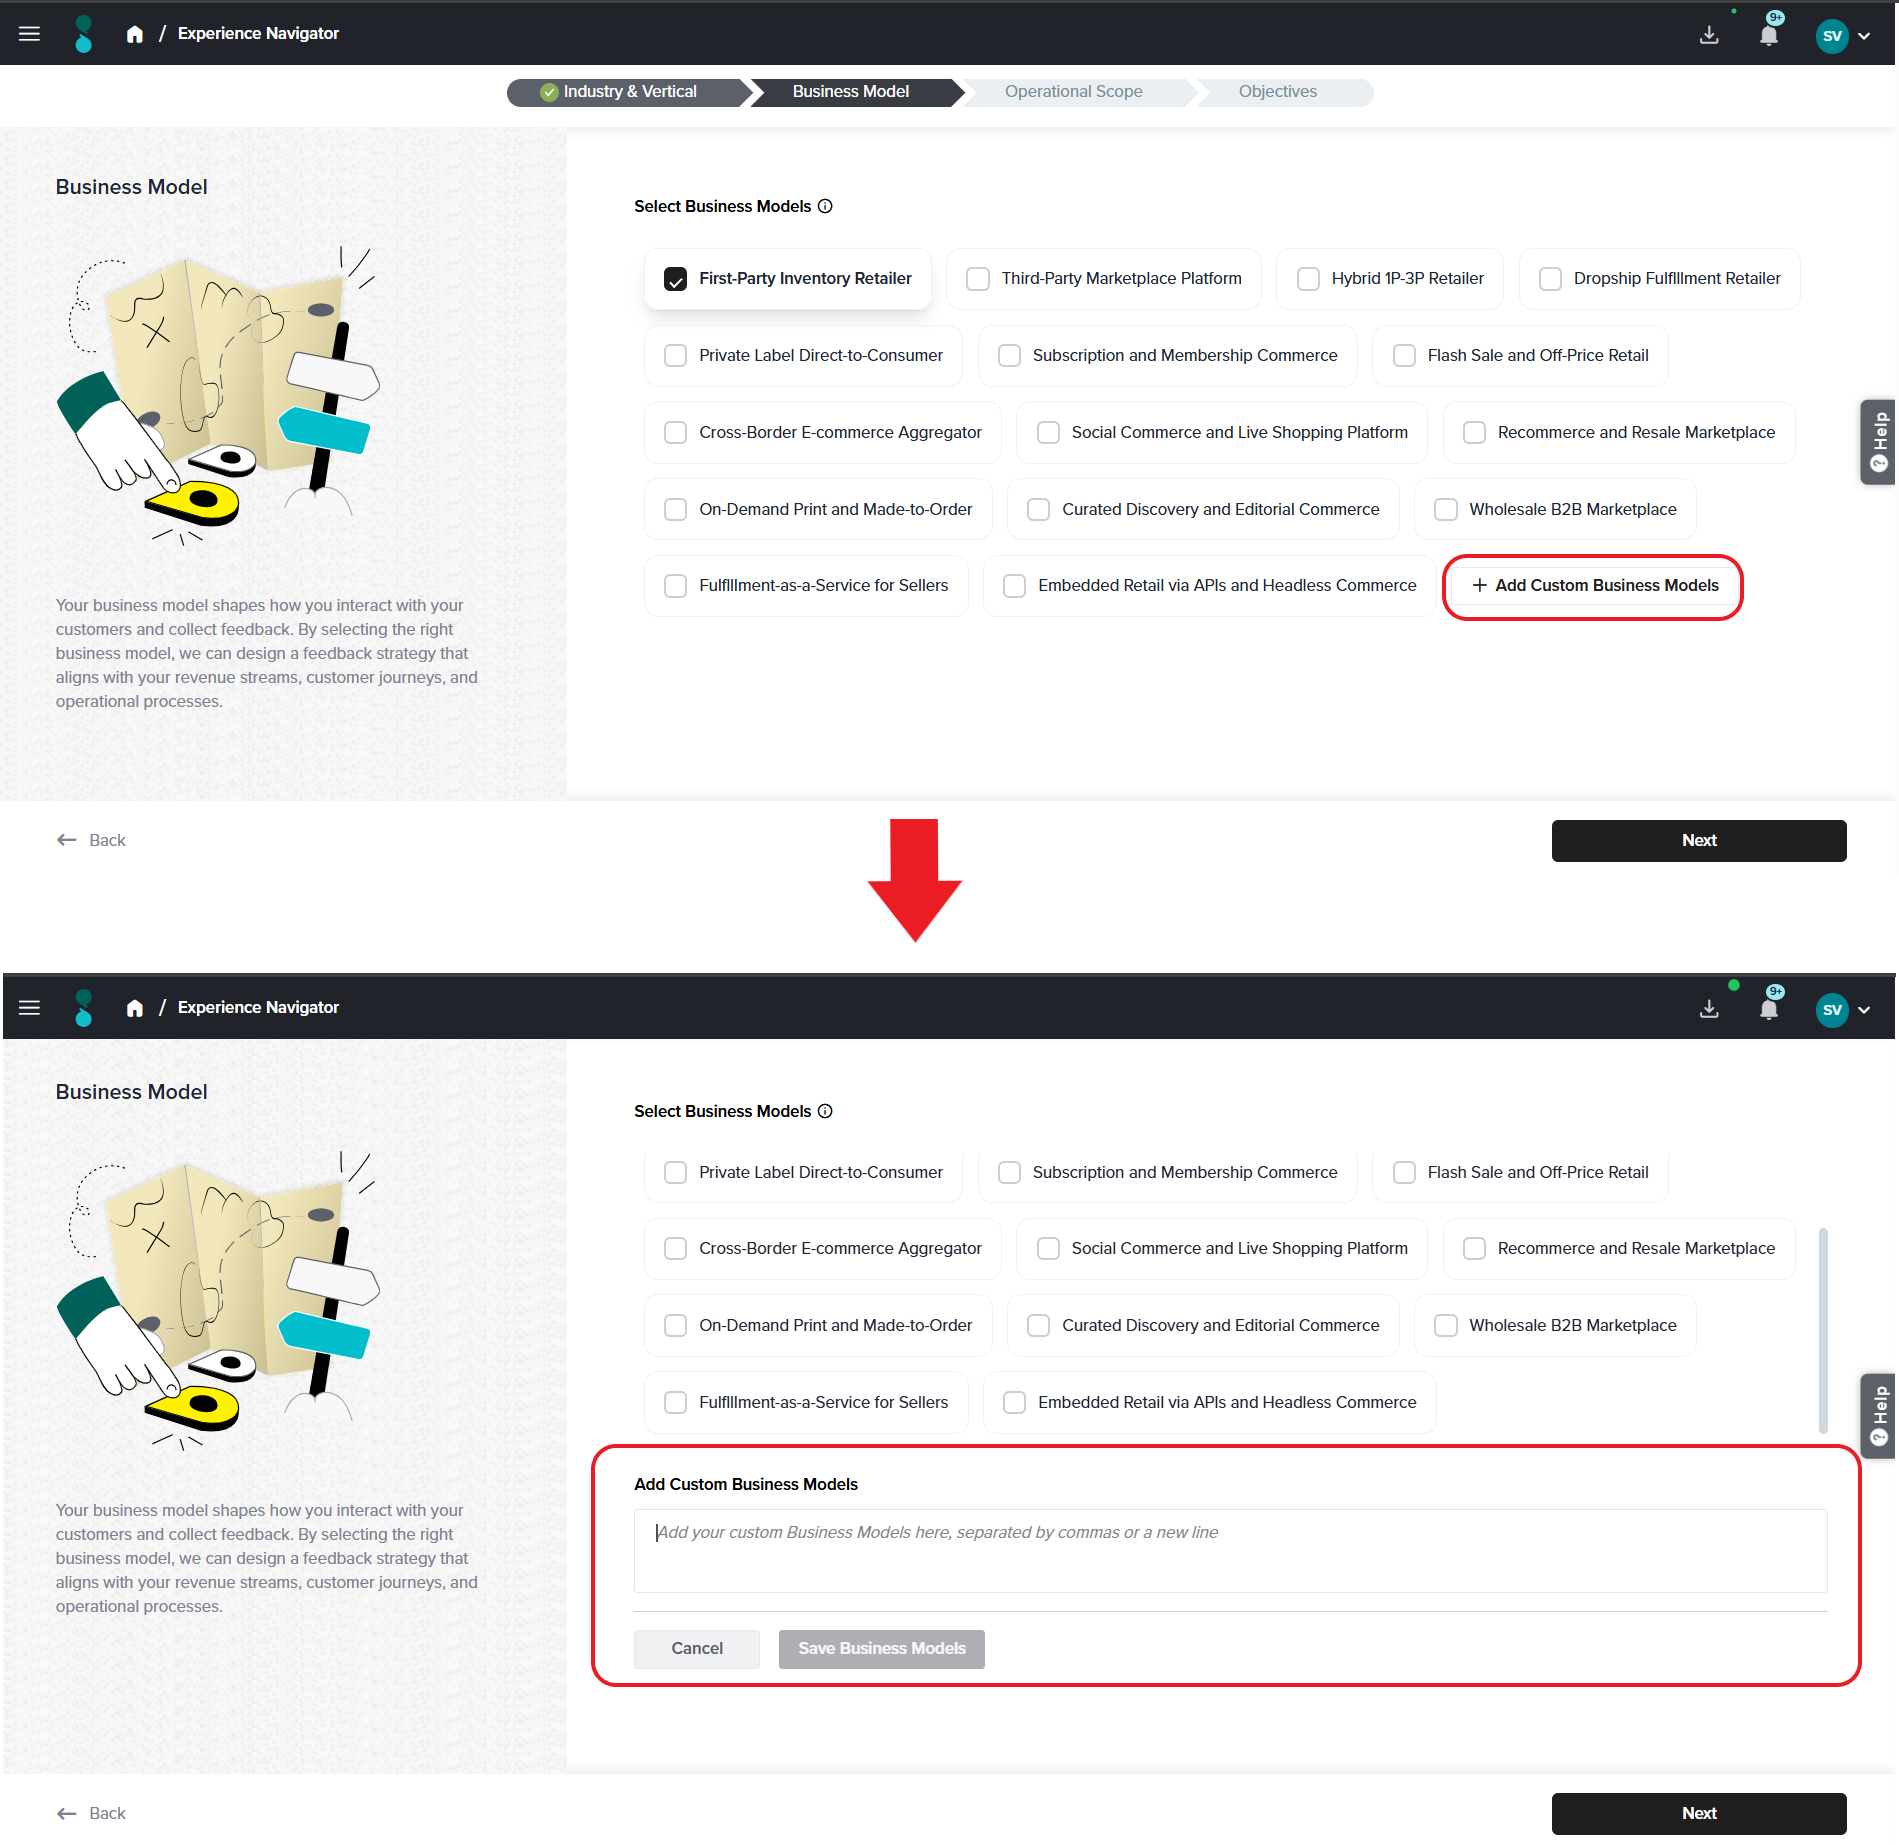
- Under Select Business Models, tick every model you operate. You can select more than one. If none of the listed models fits, select + Add Custom Business Models and describe your own.
- Select Next. The Operational Scope step opens.
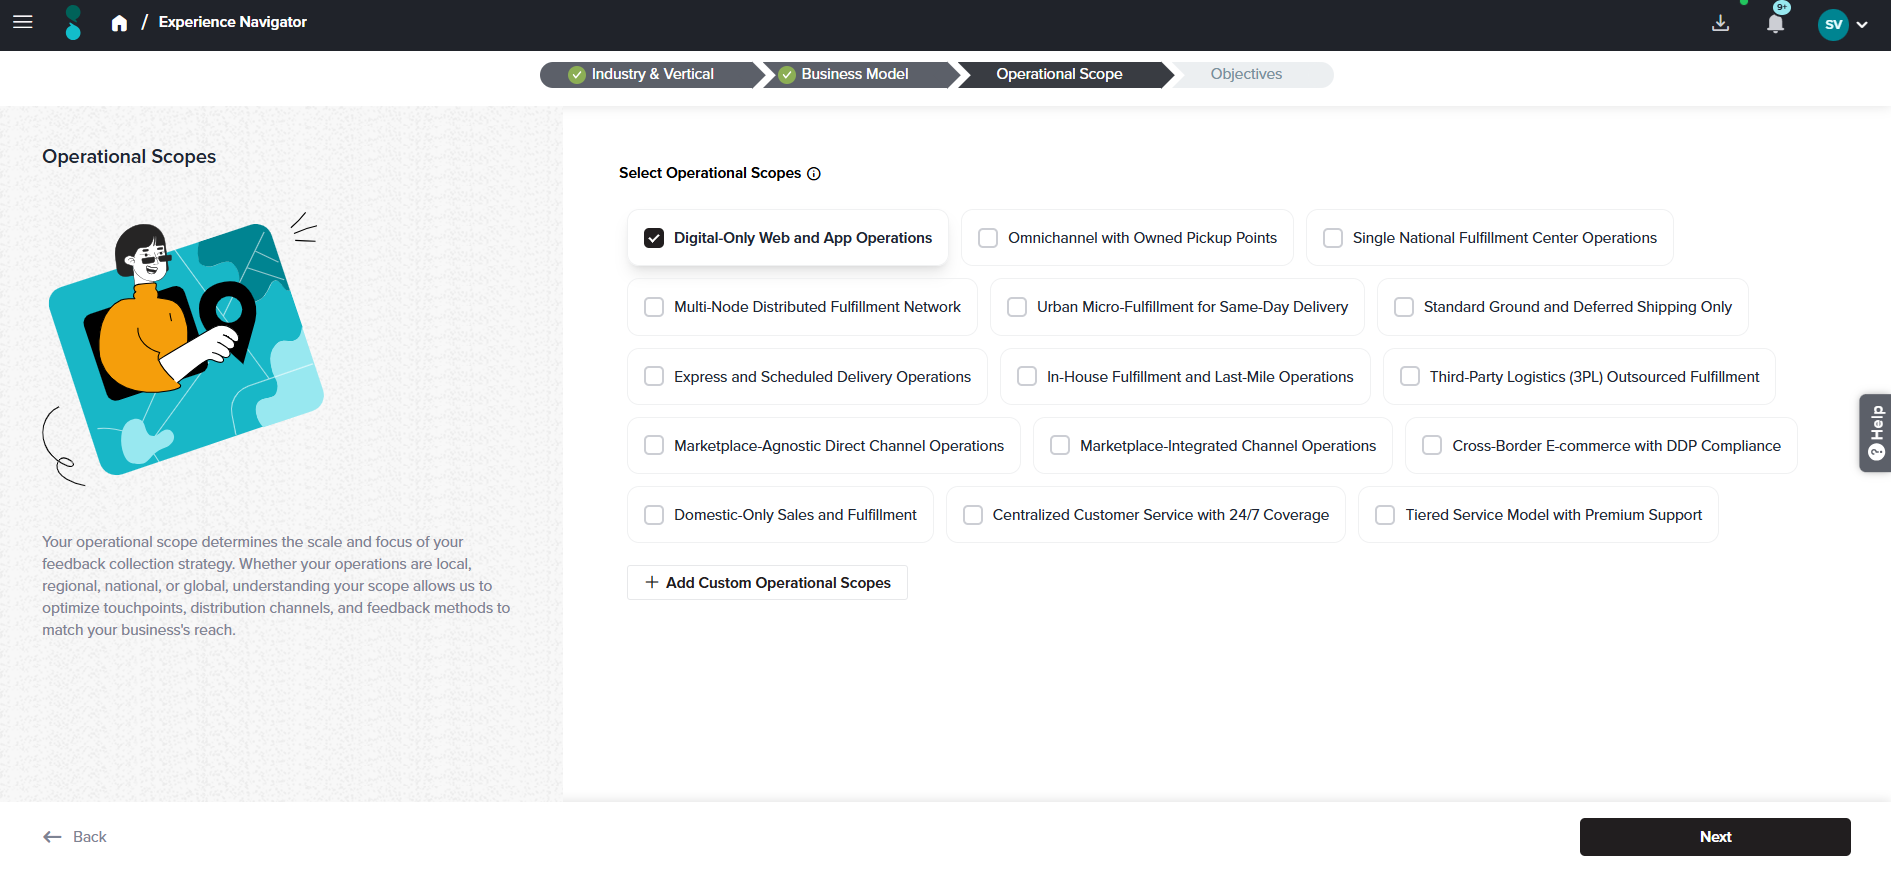
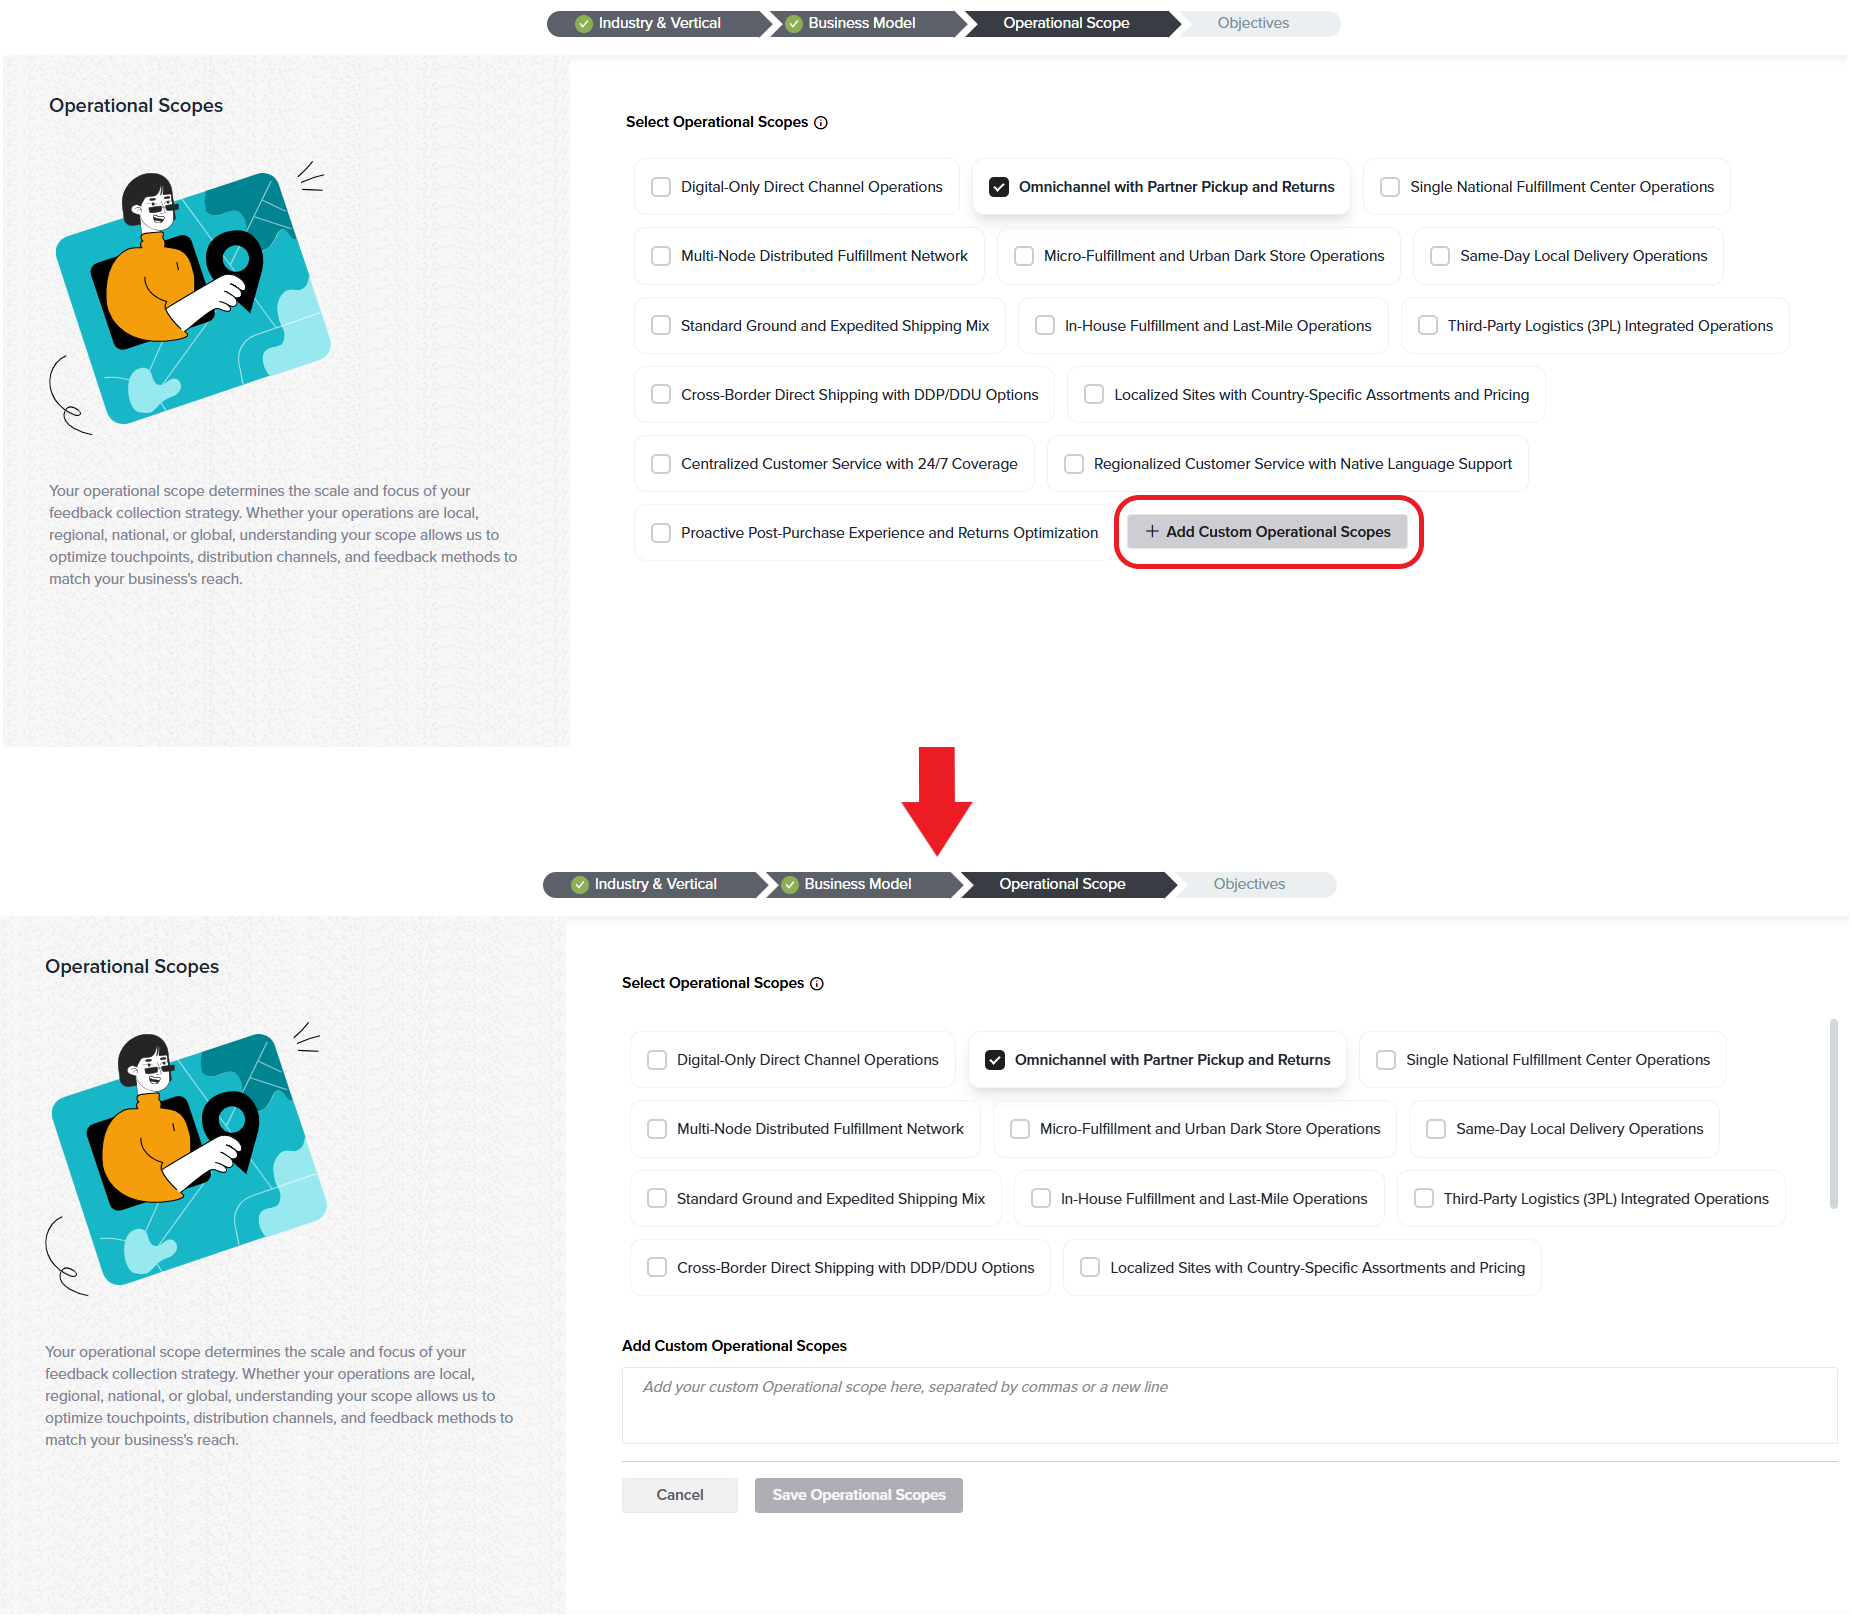
- Under Select Operational Scopes, tick every scope that describes how you operate. Select + Add Custom Operational Scopes to add one that is not listed.
- Select Next. The Objectives step opens.
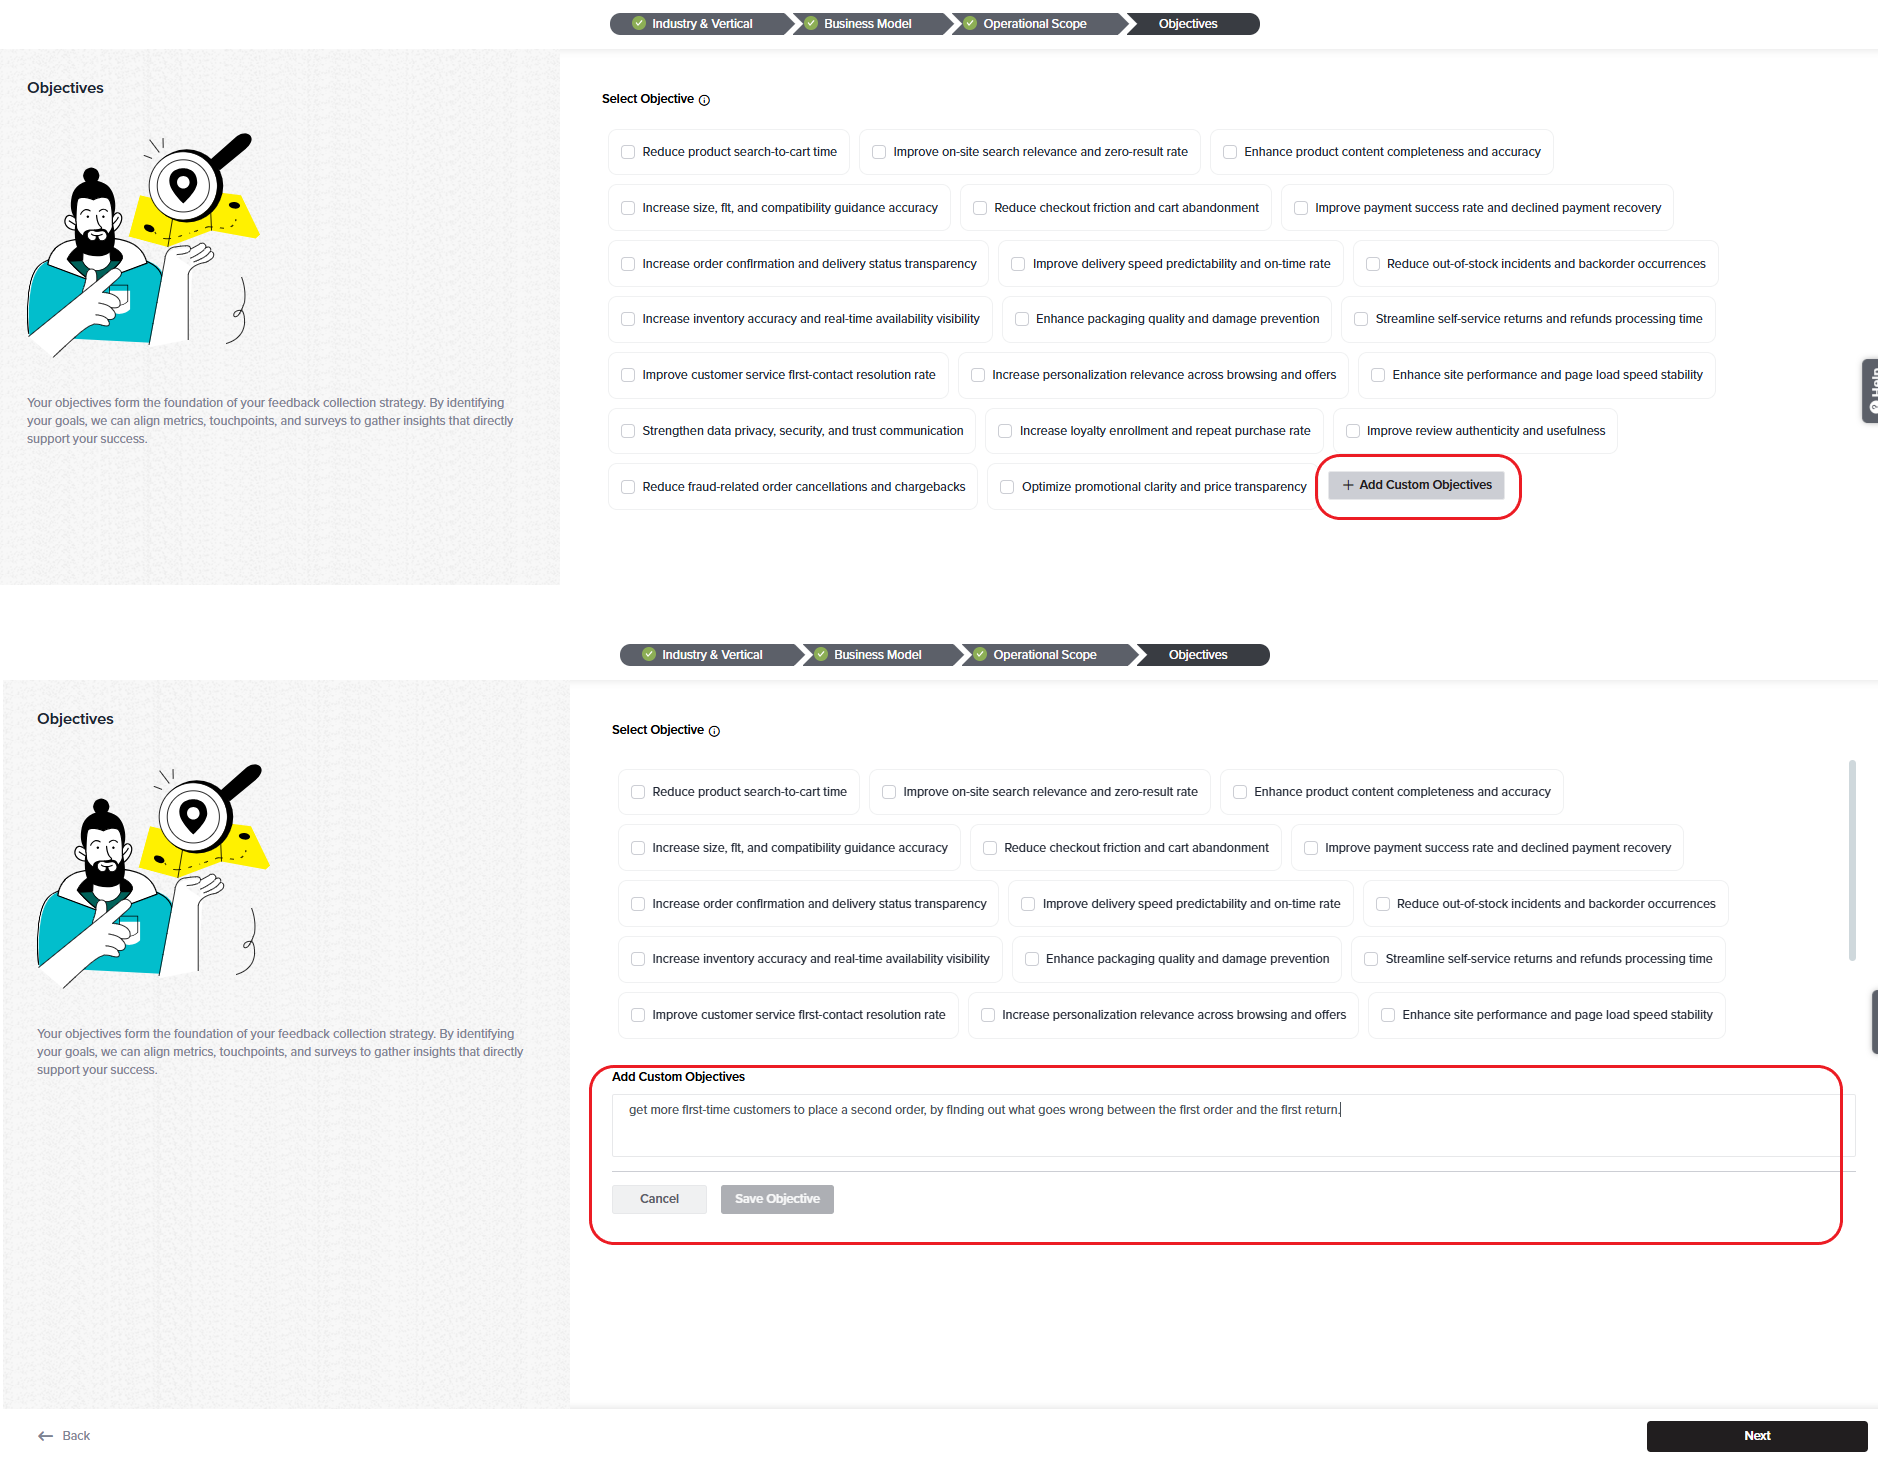
- Choose the objectives the strategy should serve, then continue to generate your strategy.
Tip: The more precisely you describe your business at these four steps, the more targeted the touchpoints, metrics, and projects will be. Selecting every business model and operational scope that genuinely applies gives a fuller journey than selecting only the closest single match.
Sam selects Let’s get started! and works through the four steps:
- Strategy Type — Customer Experience (CX), because the board’s question is about customers rather than staff.
- Industry and Vertical — Retail, then Ecommerce Marketplaces and Pure-Play Online Retail, because Brightside sells only online.
- Business Model — First-Party Inventory Retailer. Brightside buys its own stock and sells it under its own name, so this is the only model that applies.
- Operational Scope — two apply: Digital-Only Web and App Operations, since there are no shops, and Third-Party Logistics (3PL) Outsourced Fulfillment, because a partner warehouses and ships every order.
At the Objectives step, Sam sets the outcome to aim at: get more first-time customers to place a second order, by finding out what goes wrong between the first order and the first return.
Naming the audience (first-time customers), the outcome (a second order), and the part of the journey to examine (first order through first return) produces a far more useful strategy than a general aim such as “improve customer experience”.
Good to know
- Business Model and Operational Scope are multi-select. Most organizations operate more than one of each, and selecting only the closest single match produces a narrower strategy than you are entitled to.
- The options offered at the Business Model and Operational Scope steps reflect the industry and vertical you chose at the first step, so a different industry presents a different list.
What Experience Navigator Generates
Once you confirm your focus, Experience Navigator produces the following outputs as a single strategy playbook.
| Output | What it contains |
| Full Strategy Document | The complete written strategy for the objective you selected, including the reasoning behind the touchpoints, pain points, and metrics recommended. |
| Mapped Touchpoints | The digital, physical, and process-based moments where customers or employees interact with your organization, mapped across the full journey. |
| Critical Pain Points | The friction identified at each touchpoint — the moments most likely to damage the experience if they go unmeasured. |
| Key Metrics That Matter | The metrics aligned to your objective, such as Net Promoter Score (NPS), Customer Satisfaction Score (CSAT), or engagement drivers. |
| Recommended Projects | The projects Experience Navigator proposes in order to measure the touchpoints and metrics in the strategy. |
| Expected Insights | What each recommended project is designed to reveal once responses begin to arrive. |
| Ready to Use Projects | The fully configured versions of the recommended projects, created in your account when you launch. |
The metrics Experience Navigator recommends are the standard experience measures:
- Net Promoter Score (NPS) — a score derived from how likely a respondent is to recommend you, asked on a 0 to 10 scale and reported as a single number between -100 and +100. A relationship NPS asks about the relationship as a whole at a fixed point in time — 30 days after a purchase, for example — rather than about a single interaction.
- Customer Satisfaction Score (CSAT) — the proportion of respondents who report being satisfied with a specific interaction, usually expressed as a percentage.
- Customer Effort Score (CES) — a measure of how much effort a respondent had to expend to complete a task. Check the wording of the question before reading the score, because the direction of the scale depends on how the question is asked.
- Engagement drivers — in EX, the factors such as recognition, workload, or manager support that influence how engaged employees are.
Each recommended project pairs its metric with driver questions, which measure the factors believed to be influencing the score so that you can see what is moving it, and a follow-up question, which is the open-text question asking a respondent to explain the score they gave. Follow-up questions are the questions Sogolytics runs text analysis on.
From Sam’s objective, Experience Navigator returns a playbook covering six touchpoints, ten pain points, four metrics, and five recommended projects:
- Checkout Feedback — sent when someone places an order, and when someone leaves without buying.
- Delivery Feedback — sent the day after the parcel arrives.
- Returns Feedback — sent when a customer sends an item back.
- Day-30 NPS — sent 30 days after a first order.
- Day-90 NPS — the same question again at 90 days, so that the two can be compared.
The strategy document explains why first-time buyers are treated as a separate group from repeat buyers, and why the first return rather than the first delivery is treated as the end of the journey being measured.
Reviewing Your Strategy
Review the playbook before you launch anything. The strategy is a recommendation built from your objective and your industry, and it is worth checking against how your organization actually operates.
- Read the Full Strategy Document first. It explains why each touchpoint, pain point, and metric was recommended, which makes the rest of the playbook easier to assess.
- Work through Mapped Touchpoints and confirm that each one exists in your organization and is owned by a team that can act on the results.
- Check Critical Pain Points against what your support, sales, or people teams already report. Pain points you recognise confirm the strategy; pain points you do not recognise are worth investigating.
- Confirm that Key Metrics That Matter are the measures your leadership already reports on, so results land in the reviews that matter.
- Review Recommended Projects and Expected Insights together, so you know what each project is intended to prove before you field it.
Tip: Adjusting the strategy at review is faster than editing live projects after responses have been collected.
Sam accepts five of the six touchpoints without change. The sixth — asking for help — describes a contact form with no order number field, but Brightside replaced that form with live chat last month, so the friction described no longer applies. Sam notes it for adjustment before launching.
Sam also checks the timing of the two NPS projects and keeps day 90, because clothing is bought seasonally and 30 days is too soon to tell whether someone intends to come back.
Understanding Touchpoints and Pain Points
A touchpoint is any moment at which a customer or an employee interacts with your organization. Experience Navigator maps three kinds: digital touchpoints such as a website or an app, physical touchpoints such as a store or an office, and process-based touchpoints such as onboarding or a claim submission.
A pain point is the friction identified at a specific touchpoint — the part of that interaction most likely to produce a poor experience. Every pain point in the playbook is attached to the touchpoint it belongs to, so you can see where a problem occurs as well as what it is.
Experience Navigator maps six touchpoints for Brightside, with the friction it identifies at each one:
- Finding the right size (digital) — the size guide is hard to find on the product page, and reviews do not say whether an item runs large or small.
- Checkout (digital) — the delivery charge appears only at the final step, and there is no delivery date shown before payment.
- Waiting for the parcel (process) — the tracking link stops updating once the parcel leaves the warehouse.
- Opening the parcel (physical) — there is no returns slip in the box, and nothing explains how to send an item back.
- Sending an item back (process) — the customer pays the return postage, and the refund takes about two weeks to appear.
- Asking for help (process) — the contact form has no order number field, so the first reply always asks for one.
Laid out in order, the map makes the problem easier to see. Four of the six touchpoints happen after the customer has already paid, which is exactly where a first-time buyer decides whether the shop is worth using again.
Good to know
- Touchpoints and pain points are recommendations based on your objective and your industry. Validate them with the teams who own each stage of the journey before you treat the map as final.
Launching Your Recommended Projects
When the strategy is right, launch the recommended projects. Experience Navigator creates them in your account fully configured, so you do not build the surveys yourself.
- In the generated playbook, open Recommended Projects.
- Review each recommended project and the insight it is expected to produce.
- Select the projects you want to field. If you are not ready to run the full set, start with the projects that cover your highest-priority touchpoints.
- Launch the selected projects. Experience Navigator creates them in your account as ready-to-use projects.
- Open a launched project from All Projects — the area of your account that lists every project you own or have been given access to — to review its questions, apply your branding, and adjust the wording to match your organization.
- Distribute the project as you would any other Sogolytics project — by email invitation, link, embedded code, QR code, or any other supported distribution method.
Tip: Launch a small set of projects first, confirm that the responses answer the question you set out to answer, then field the remainder.
Sam launches three of the five projects first — Checkout Feedback, Delivery Feedback, and Day-30 NPS — because these cover the steps almost every first-time customer reaches. Returns Feedback waits until the returns team has been told it is coming, and Day-90 NPS waits until the earliest customers are 90 days past their first order.
The projects arrive ready to send, so the only changes Sam makes before distributing them are adding the Brightside logo and colours, and shortening two questions.
Good to know
- Launching creates real projects in your account. Standard project limits, package entitlements, and user permissions apply to the projects Experience Navigator creates, exactly as they do to projects you build yourself.
- Projects created by Experience Navigator are fully editable. Review the question wording and the branding before you distribute them.
Where Your Strategy Appears After Launch
Once responses begin to arrive, the strategy Experience Navigator generated becomes the structure you analyze against.
- The projects appear in All Projects with the rest of your account, where you can manage, edit, and distribute them.
- Responses feed the CX Dashboard or the EX Dashboard — the analysis areas where responses from several projects are combined and tracked over time, rather than read one project at a time. The metrics recommended in your strategy are tracked there.
- The mapped touchpoints give you the structure for a journey map, a view that arranges your feedback by the stages a customer or employee passes through, so a metric can be read stage by stage instead of as a single overall score.
Tip: Apply Tags consistently across the projects Experience Navigator creates. A Tag is a label applied to the metric and driver questions in a project so that results from different projects can be grouped together, and Tags are what allow the CX and EX Dashboards to report by touchpoint, product, or department across several projects at once.
Sam tags every launched project First Order, and adds a second tag naming the step it covers — Checkout, Delivery, or Returns. Six weeks later, the CX Dashboard filtered to the First Order tag shows:
- Delivery Feedback: 88% satisfied when the parcel arrived on the day promised, against 34% when it arrived later. The problem is the promised date, not the courier.
- Checkout Feedback: an effort score of 4.5 out of 7, worst among first-time customers.
- NPS is 12 at day 30. The day-90 project has not run yet, so there is nothing to compare it with.
- The most common theme in the written comments — the subject text analysis finds recurring — is Sizing, and the most common emotion is Frustration.
Sam expected delivery to be the main complaint. The comments say sizing. That moves the first fix to the product page rather than the courier, and it is a conclusion that a single overall satisfaction score could not have produced.
Subscribe for tips and insights to drive better decisions!