- Getting Started!
- Building EX Surveys
- EX Metrics
- EX Dashboard
- EX Dashboard Settings
- Analyze your drivers
- Good to know
- Getting Started!
- Why Sogolytics
- Getting Started with Sogolytics
- Tour
- Home
- Verify My Account
- Account Creation
- Introduction to Packages
- Mobile App
- Design
- Introduction to Project Design
- Project Types
- Create a Project
- Question Types
- Question Types
- Add a Question
- Mobile Friendly Questions
- Edit a Question
- Introduction to Simple Question Types
- Introduction to Grid Questions
- Horizontal Radio Button
- Descriptive Text
- Text Box
- Radio Button (Single-Select)
- Drop Down
- Check Box (Multi-Select)
- Demographic
- Rating Scale
- Symbol Rating Scale
- Like/Dislike
- Ranking
- Date
- Image Choice
- Net Promoter Score (NPS)
- Multiple Text Box
- Multiple Drop Down
- Radio Grid
- Check Box Grid
- Rating Radio Grid
- Rating Drop Down Grid
- Rating Scale Grid
- Matrix Grid
- Advanced Questions and Elements
- Page Break
- Captcha
- List Box
- Rating Drop Down
- Rating Radio Button
- Attachment
- Numeric Allocation
- Drill-Down
- Signature
- Re-use Questions and Answers
- Advanced Design Options
- Project Logic
- Page Action
- Project Tools
- Project Options
- Introduction to Project Options
- Conditional Auto Save
- Project Details
- Add Languages
- Question Sequence
- Anonymous Project
- Display Options
- Event Messages
- Save Survey Edit Later Option
- Save Responses Continuously
- Thank You Message
- Reopen Submitted Responses
- Use Chain Invitations to Share Surveys
- URL Redirect: Static and Dynamic
- Print Options
- Expiry Rules
- Switch Project Type
- Enhanced Participation
- Automatic Email Alerts
- Question Features
- Project Branding and URL Customization
- Project Customization
- Good to Know
- Distribute
- Introduction
- Publish Project
- Other Publishing Options
- Automated Distribution
- Invitation Templates
- Contact Lists
- Reminders
- Customizing Participation
- Good to Know
- Directory
- Participation
- Track
- Report
- Introduction to Reports
- Run a Report
- Omni All in One Report
- Text Analysis
- Frequency Reports
- Individual Responses
- Raw Data
- Special Reports
- Legacy Reports
- Charts and Graphs
- Save, Export, Share Reports
- Filter Manager
- Good to Know
- Custom Dashboard
- Introduction to Custom Dashboard
- Build Your Custom Dashboard
- Widgets
- Filter
- Segmentation
- Data Management
- Privacy And Compliance
- Integrations and API
- Account Administration
- Account Settings
- Account Settings
- Update Personal Information
- Update Company Information
- Account Notifications
- Review Account Usage
- Customize Survey Labels
- Project Allocation
- Linked Account
- View Product Details
- Referral Program
- Payment History
- Billing Information
- Two-Step Authentication
- Account Security
- Recent Account Activity
- Single Sign-On (SSO)
- Outbound Email Settings
- Compliance
- Email Settings
- Project Branding
- Manage Sub-Users
- Good to Know
- Billing
- Introduction
- Sign Up and Upgrade
- Acceptable Payment Methods
- Upgrade a Paid Account
- Payment Receipts
- Change Billing Information
- Upgrade Using Purchase Order
- Referral Benefits Program
- Sogolytics Plans
- Payment Methods Available
- Failed Payment
- Switch to Annual Billing
- Upgrade a Free Pro or Tral Account
- Sign Up for a Paid Account
- Sogolytics Standard Support
- Downgrade or Cancel Account
- Poll Project
- Good to Know
- FAQs
- Getting Started!
- Building CX Surveys
- CX Metrics
- CX Dashboard
- CX Dashboard Settings
- Analyze your drivers
- Good to know
- Getting Started
- Account Set-up
- Account Administration
- Introduction to Account Administration
- Managing Users
- User Groups
- Landing Pages
- Tab Editor
- Critical Alerts
- Enable Browser Based Notifications
- Customer Feedback Preferences
- Turn Emails into Dialogues
- Account Activity Log
- Define Dialogue Aging
- Create Tags
- Comparison Overview
- Raise a Dialogue with Sogolytics
- Safelisting
- Inbox
- Dialogues
- News
- SogoConnect Dashboard
- Campaigns
- Help
- Getting Started!
- Assessment Question types
- Score and more
- Quiz participation
- Get Results
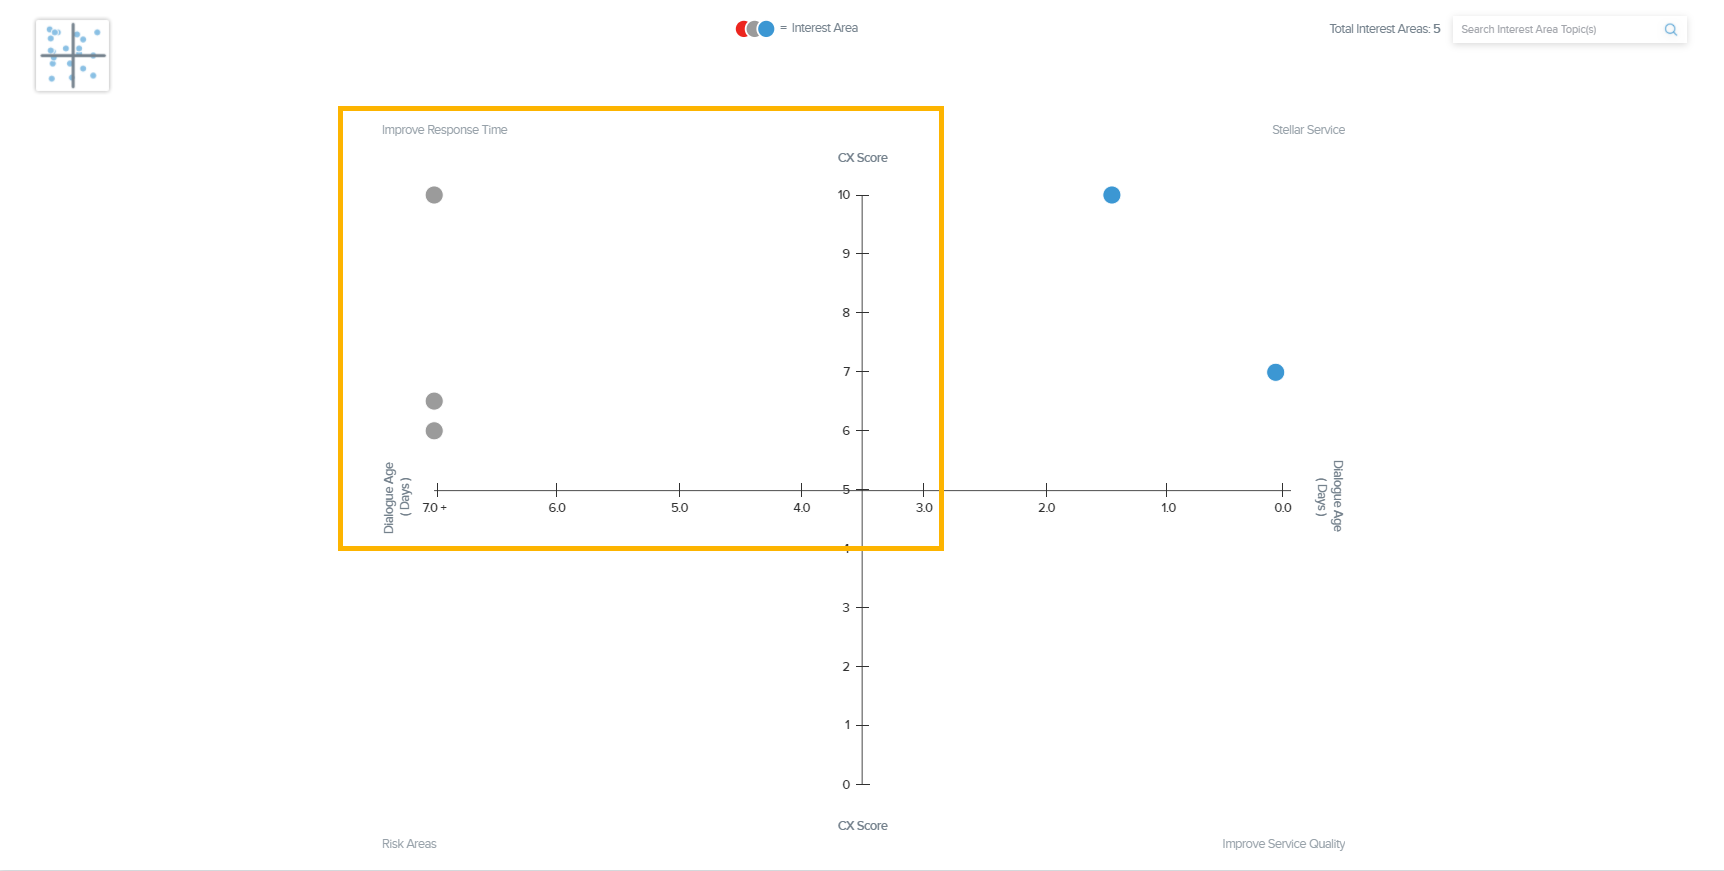
To access the Comparison Report in SogoConnect, close the Overview column on the left hand side of the screen. You’ll then see Comparison options in the column. You can compare Users, Interest Area Categories, and Interest Area Topics.
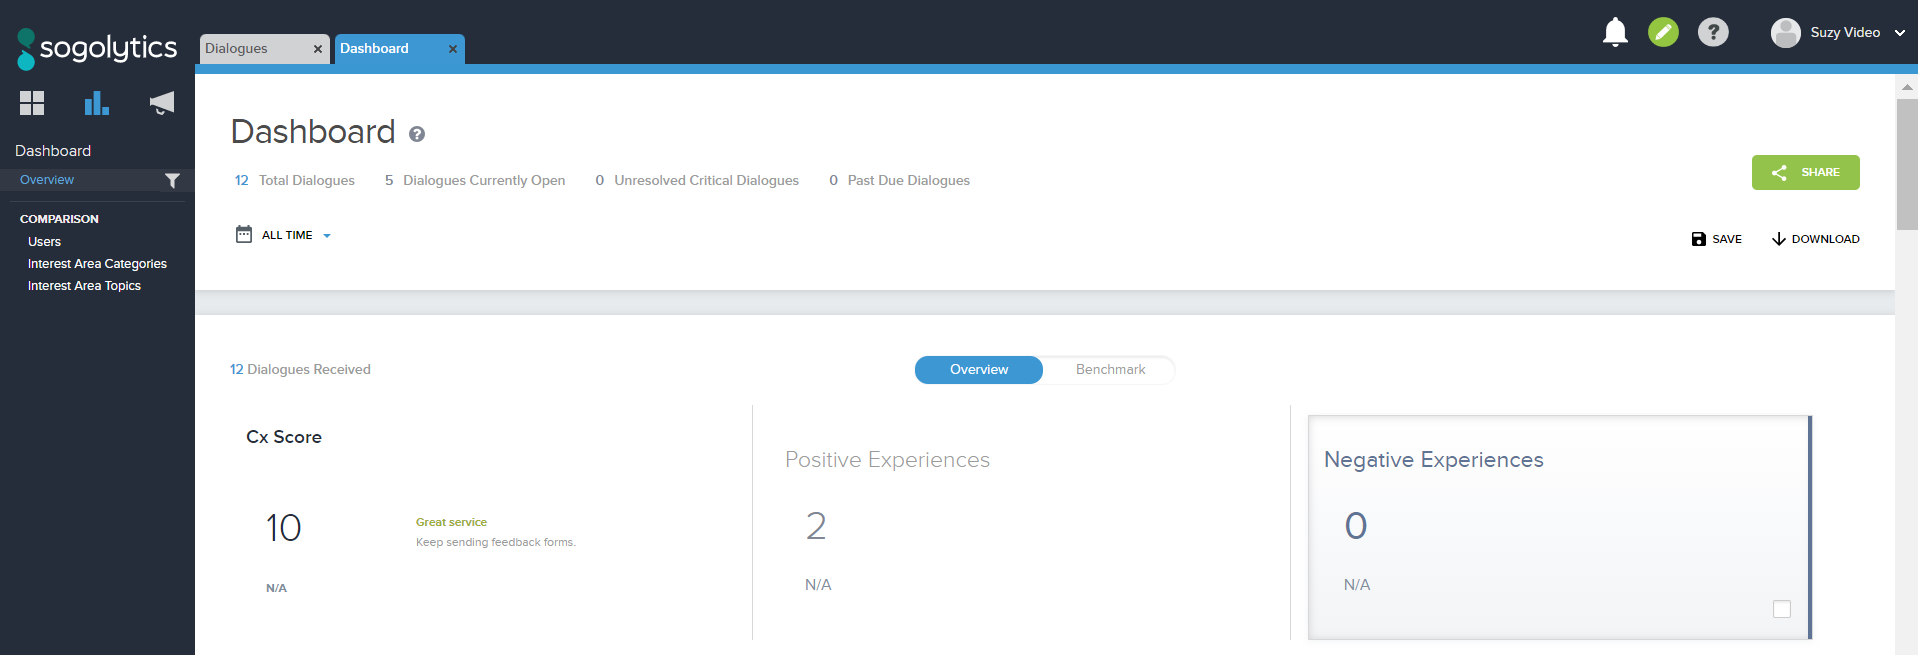
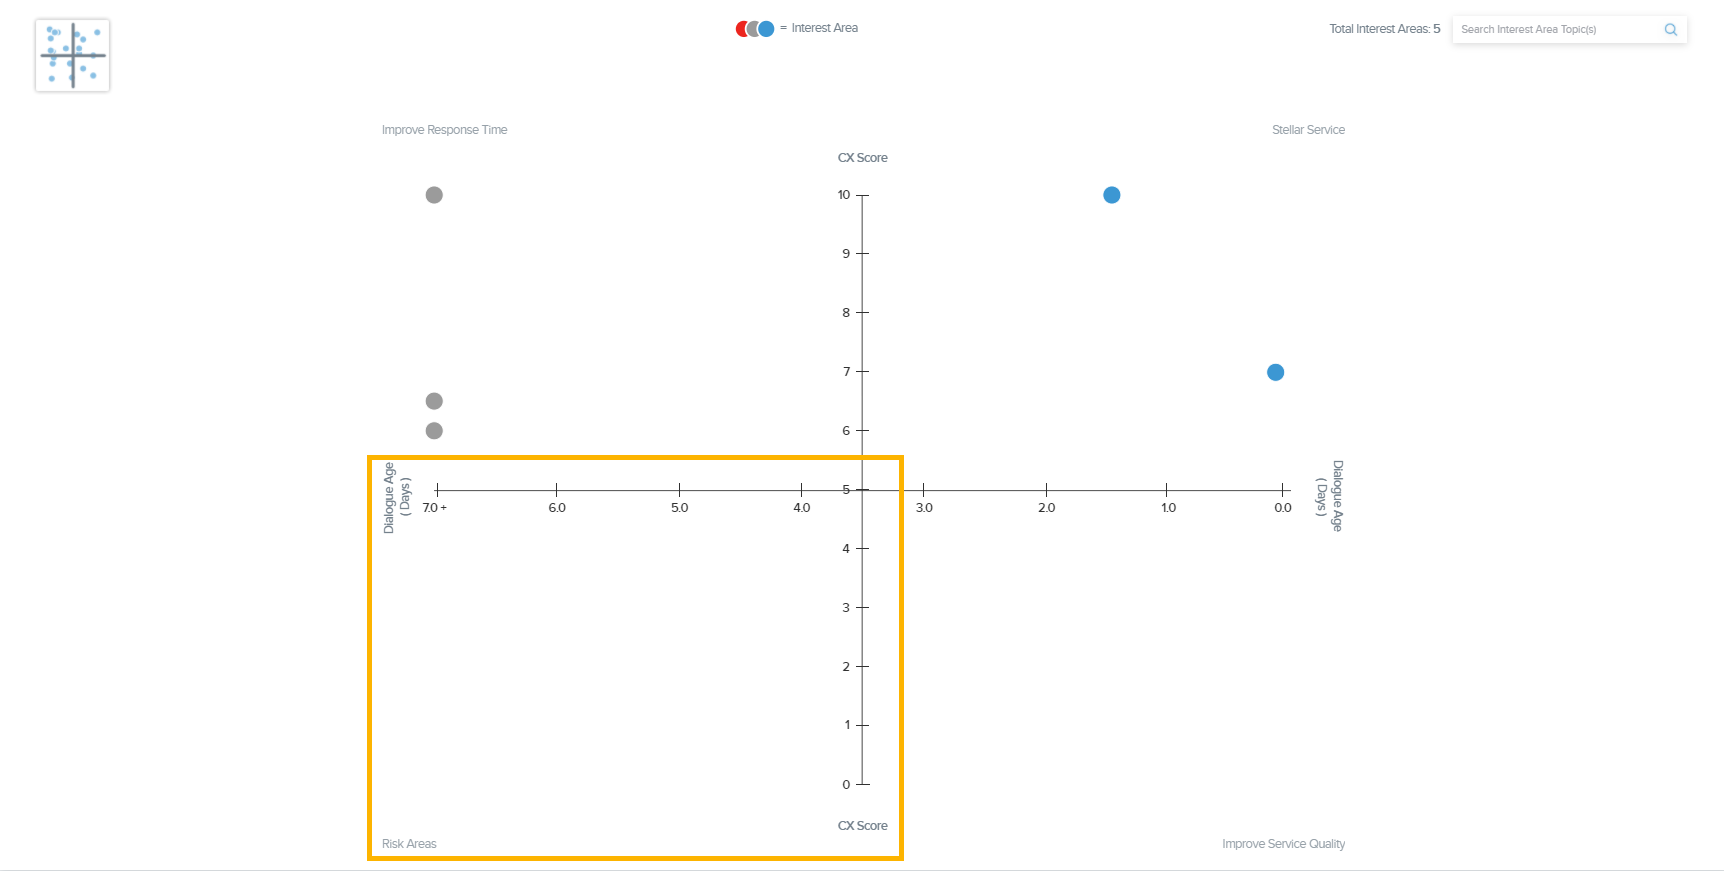
Within the SogoConnect Dashboard, you can compare three main areas on a four quadrant graph. Each quadrant is different and will let you know where you’re excelling and where you need work. The x-axis represents the Dialogue Age, while the y-axis represents the CX Score.
Let’s breakdown what each quadrant means:
Stellar Service: It’s the top right quadrant and it means that the User/Interest Area Category/Interest Area Topic has a high CX Score and a short Dialogue Age.
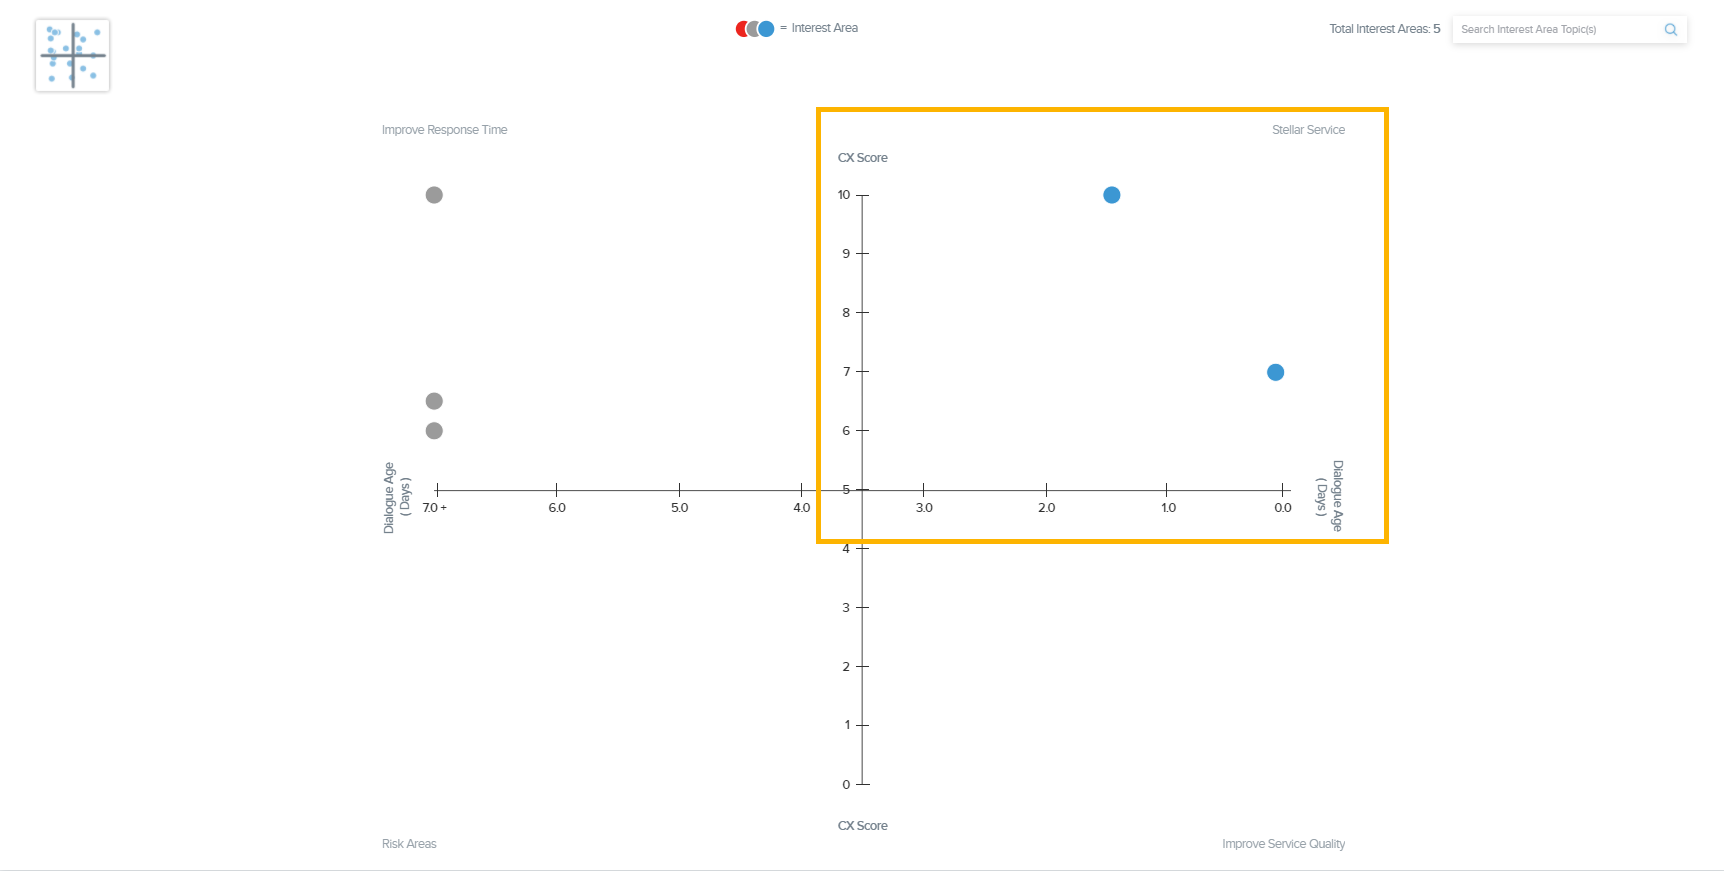
Improve Service Quality: This is the bottom right quadrant, and it means that anything here has a short Dialogue Age but a bad CX Score.
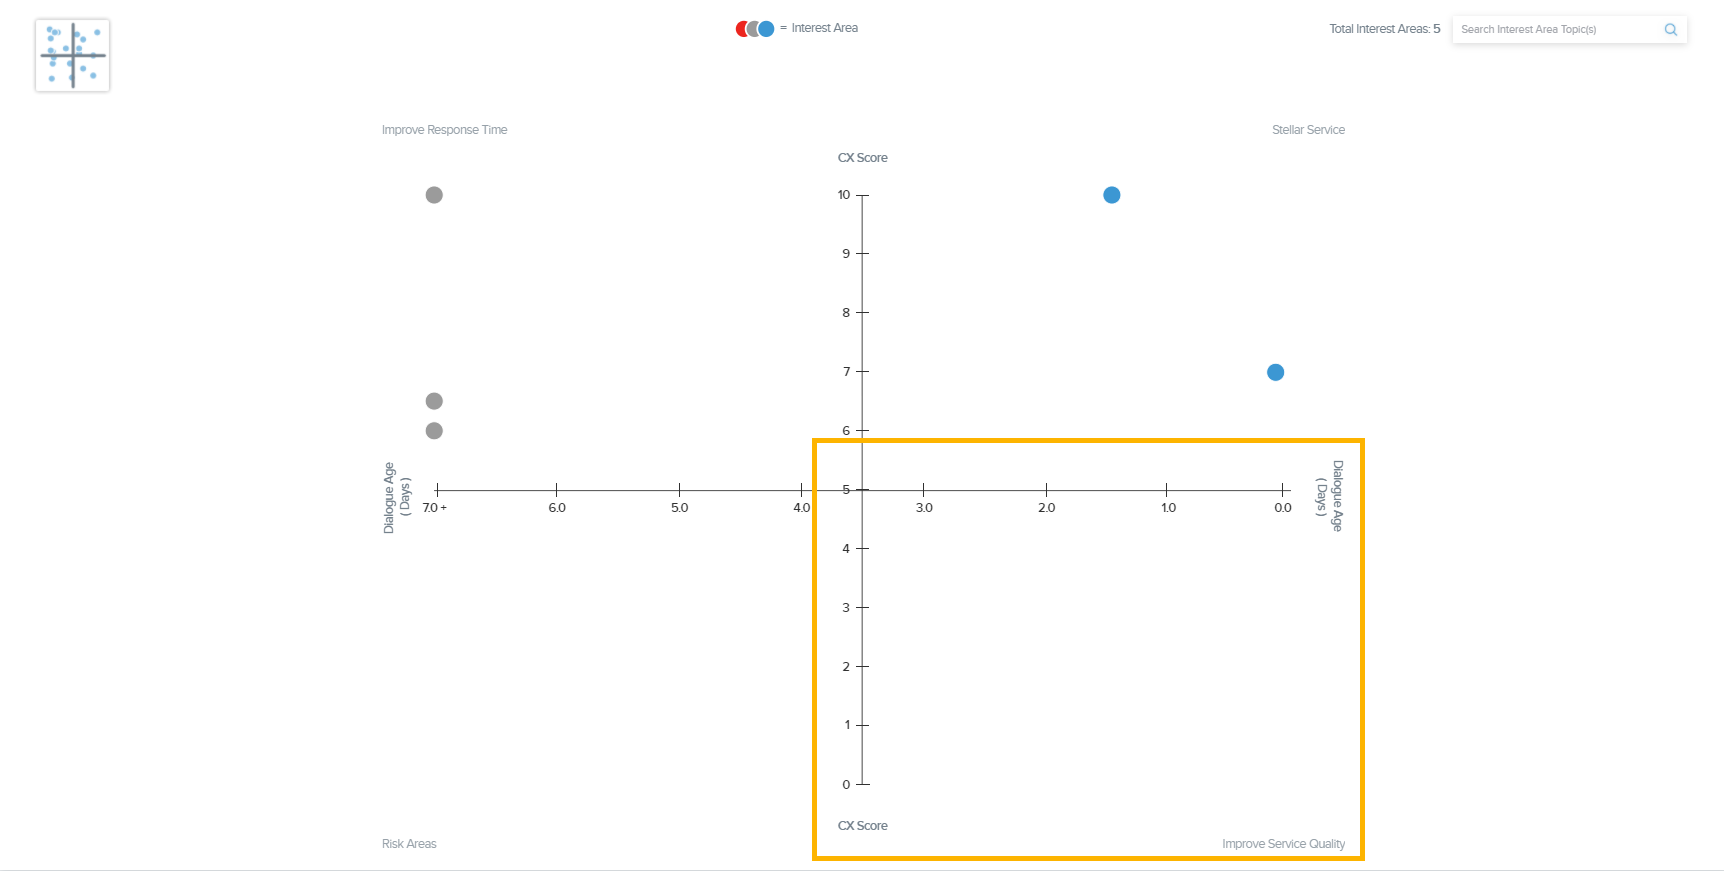
Improve Response Time: This is the top left quadrant and it means that whatever is in there has a high CX score but a long Dialogue Age.
Risk Areas: This is the bottom left quadrant and if anything is here that means you need to immediately improve it. Anything in the Risk Area quadrant means that it has a low CX Score and a long Dialogue Age.
The comparisons in SogoConnect can show how your team is doing internally, and that means showing what is excelling and what is falling behind.
- Users
- Interest Area Categories
- Interest Area Topics
Subscribe for tips and insights to drive better decisions!