

Score in Omni
The Score option in Omni offers multiple ways to calculate the scores obtained on rating questions. While the term “score” is used here, this option is available in both survey and assessment projects. Score may be customized here as a Weighted Score, Percent Favorable, or Net Score.
Score can be shown as:
- Overall Score, a cumulative value of selected questions
- Question Scores, a graph of weighted scores of selected rating question
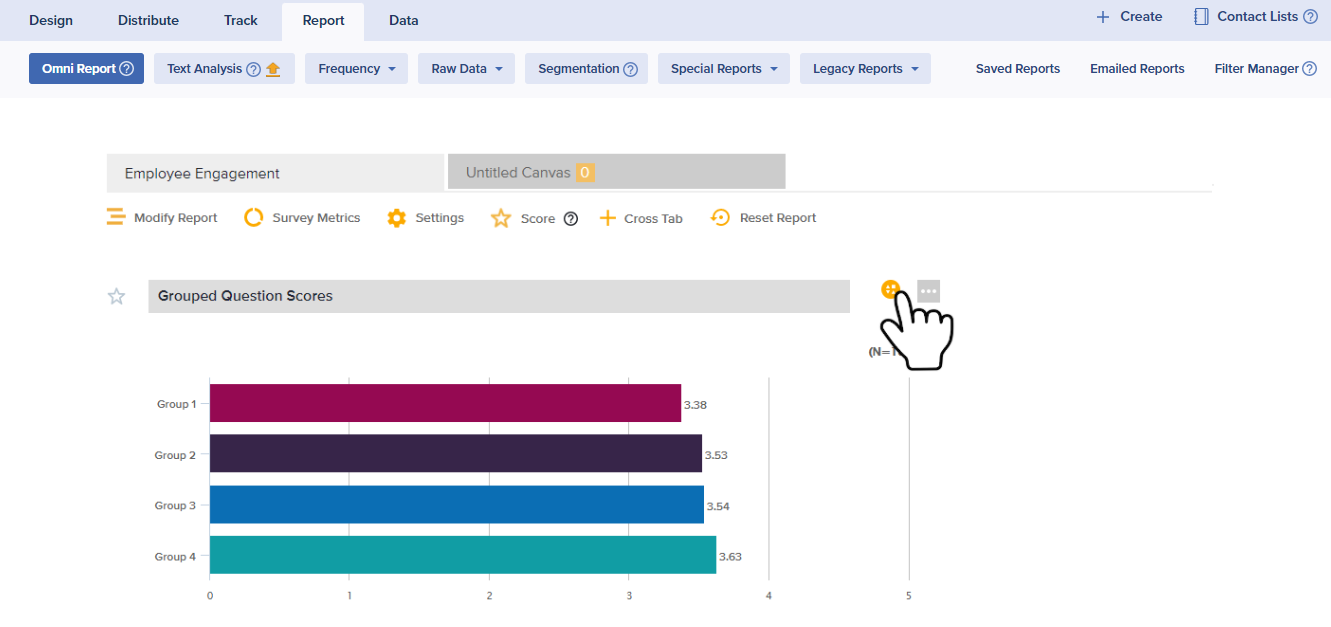
- Grouped Question Scores, multiple graphs of rating question available in the project
Here’s how to add Weighted Score, Net Intent, and Percent Favorable variations to your Omni Report:
- Select your project, then click on Report to view the Omni Report.
- Click the Score icon at the top of the report.

- Select the score type you want to display. Provide a description for the Score and select its position in the report. By default, the Score will be placed at the beginning of the report, but you can change this from the dropdown menu.
- If you choose Net Intent or Percent Favorable, you may choose to customize the score calculation by clicking on the customize icon beside the dropdown.

- Customize Net Intent
If you choose to customize the Net Intent, all rating questions will be displayed with scale answer options categorized as Positive, Neutral, and Negative. Note that only positive and negative weights are considered while calculating Net Intent. Neutral weights are discarded in the calculation. Click each answer to change the default classification assigned. When you are finished, click Save to apply the changes and close the modal.
 Default weights assigned to the answer options of the rating scale are based on the formula below (where N = Total number of weights):
Even Scale = (N-2)/2 would be positive and negative weights. The values in the middle are considered Neutral.
Odd Scale = (N-1)/2 will be positive and negative weights. The value in the middle is considered Neutral.
- Customize Percent Favorable
If you choose to customize the Percent Favorable, all rating questions will be displayed with specific scale answer options categorized as Positive. Note that only positive weights are considered when calculating Percent Favorable. Click each answer to change the default classification assigned. When you are finished, click Save to apply the changes and close the modal.
- Customize Net Intent
- Next, choose from the following options to configure the score:

- Overall Score: This option displays the cumulative Weighted Score/Net Intent/Percent Favorable of all selected questions.
- Click Select Questions and choose the questions that should contribute to your score.
- Click to Assign Weights to the rating questions. [Option available only for Weighted Score]

- By default, weights are split evenly across all selected questions, as well as across sub-questions. Make any required changes to the weights here.
The total needs to add up to 100% (both for all questions and for each set of sub-questions).
- Once you’re done, click Save to close and return to Omni.
- By default, Overall Score is displayed as a number widget, but it can also be converted into a Horizontal or a Vertical Bar Graph or Dial.

- Overall Score: This option displays the cumulative Weighted Score/Net Intent/Percent Favorable of all selected questions.
- Click Select Questions and choose the questions that should be shown in the graph.
- Click to Assign Weights to the rating questions. [Option available only for Weighted Score]
Weights cannot be applied to non-grid questions for this configuration.

- By default, weights are split evenly across all selected questions, as well as across sub-questions. Make any required changes to weights here.
The total needs to add up to 100% (both for all questions and for each set of sub-questions).
- Once you’re done, click Save to close and return to Omni.
- By default, Question Score is displayed as a Horizontal Bar Graph, but it can also be converted to a Vertical Bar Graph.
Weighted Score graph for Question Scores

Net Intent Score graph for Question Scores

Percent Favorable Score graph for Question Scores

Grouped Question Scores: This option displays the Weighted Score/Net Intent/Percent Favorable of various question groups in a single graph.
- Click Select Questions.
- By default, two groups of questions are defined, but you can create up to 15 groups.

- Define the number of groups and add the desired questions to each group.
- To add a Saved Filter, click on the filter icon on the right of the Group name. You may apply different filters to different groups.
- Hover to edit the group names.
- Click to Assign Weights to grouped questions. [Option available only for Weighted Score]
- By default, weights are split evenly across all selected questions, as well as across sub-questions. Make any required changes to weights here.
The total needs to add up to a 100% (both for all questions and for each set of sub-questions).
- Once you’re done, click Save to close and return to Omni.
- By default, Grouped Question Score is displayed as a Horizontal Bar Graph, but it can also be converted to a Vertical Bar Graph.
Weighted Score graph for Grouped Question Scores

Net Intent Score graph for Grouped Question Scores

Percent Favorable Score graph for Grouped Question Scores

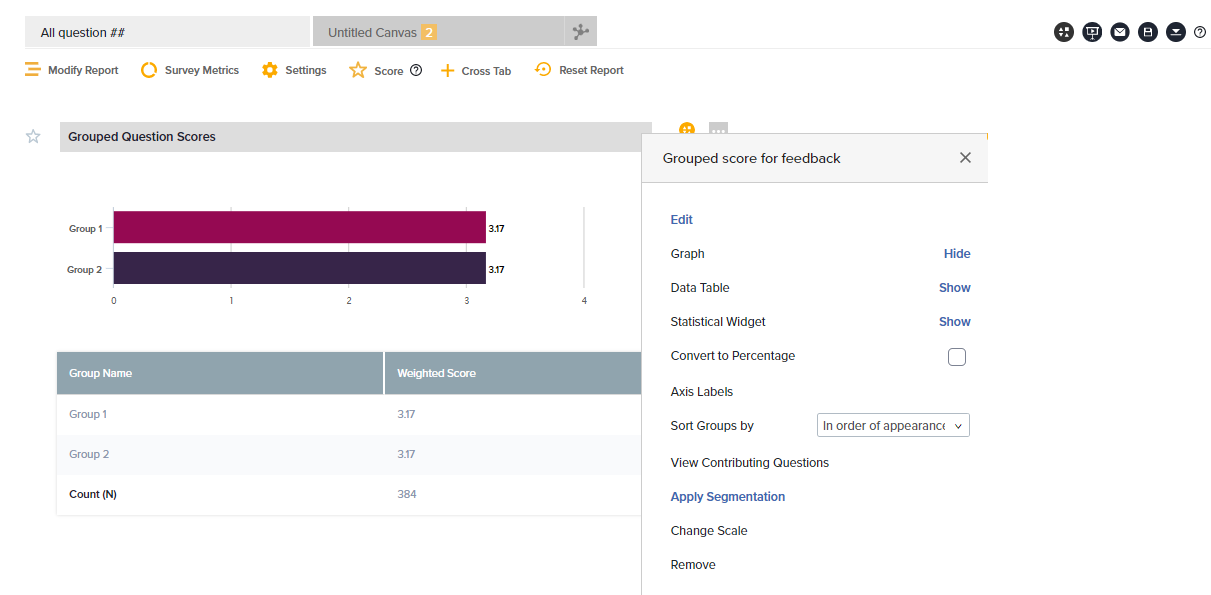
- Show/Hide Graph
- Show/Hide Table
- Convert score to percentage
- Customize Graph with following options:

- Number Widget
The number widget is only available for the Overall Score.
- Horizontal Bar Graph
- Vertical Bar Graph
- Dial
- Number Widget
- View Contributing Questions: Display the questions included in the calculation and choose to add or remove any contributing questions.

- Apply Segmentation: To drill down to a deeper understanding of your results, you can apply segmentation based on the question and answers of your choice or create data sets to compare. Learn More.

- Change Scale: If all rating questions use the same scale, the Change Scale drop down will be disabled.
- If questions in the Overall Weighted Score calculation include different scales (5-point, 7-point, etc.), you may choose to change the scale.

- By default, Score is based on the most commonly occurring scale in your project, and scores for all rating questions included are normalized according to this scale.
For example:
If your survey contains two 10-point scale rating questions, and one 5-point scale rating question, Score will extrapolate the data for the 5-point scale question to a 10-point scale. In this example, a rating of 3 on the 5-point scale will be shown as a rating of 6 on the 10-point scale.
- If questions in the Overall Weighted Score calculation include different scales (5-point, 7-point, etc.), you may choose to change the scale.
- Remove: Removes the Score display from the Omni report.
Additional Score Options
- Split grid questions
- By default, all sub-questions within a Grid are considered to be part of the same question. To consider each Grid sub-question as a standalone question within Question Scores, use Split Sub-questions.
- Group questions by assessment category
- If you’re working on an assessment and you’ve divided questions into categories within Design, this option in Group Scores allows you to quickly reuse the same categories.
- Question Scores and Grouped Question Scores display settings:
- Click the gear icon in the Question Scores/Grouped Question Scores, to set up display conditions for the questions and the groups.
- You may choose to:
- Show all Questions/Groups: Default settings, display all the selected questions/groups.
- Show only Top/Bottom Questions/Groups: Select a number here based on your requirement.
- Show only Above/Below Average Questions/Groups: Select this option to view only the top or bottom values.
- Sorting Question Scores and Grouped Question Scores:
- Once you have configured the Question Scores or Grouped Question Scores, click on the three dots icon to sort the scores.
- Sorting options:
- In order of appearance
- In alphabetical order (A to Z)
- In alphabetic order (Z to A)
- Highest to Lowest
- Lowest to Highest
- When segmentation is applied to the Question Scores or Grouped Question Scores, ‘Highest to Lowest’ and ‘Lowest to Highest’ are not available.
