- Getting Started!
- Building EX Surveys
- EX Metrics
- EX Dashboard
- EX Dashboard Settings
- Analyze your drivers
- Good to know
- Getting Started!
- Why Sogolytics
- Getting Started with Sogolytics
- Tour
- Home
- Verify My Account
- Account Creation
- Introduction to Packages
- Mobile App
- Design
- Introduction to Project Design
- Project Types
- Create a Project
- Question Types
- Question Types
- How to add a Survey Question
- Mobile Friendly Questions
- Edit a Question
- Introduction to Simple Question Types
- Introduction to Grid Questions
- Horizontal Radio Button
- Descriptive Text
- Text Box
- Radio Button (Single-Select)
- Drop Down
- Check Box (Multi-Select)
- Demographic
- Rating Scale
- Symbol Rating Scale
- Like/Dislike
- Ranking
- Date
- Image Choice
- Net Promoter Score (NPS)
- Multiple Text Box
- Multiple Drop Down
- Radio Grid
- Check Box Grid
- Rating Radio Grid
- Rating Drop Down Grid
- Rating Scale Grid
- Matrix Grid
- Advanced Questions and Elements
- Page Break
- Captcha
- List Box
- Rating Drop Down
- Rating Radio Button
- Attachment
- Numeric Allocation
- Drill-Down
- Signature
- Re-use Questions and Answers
- Advanced Design Options
- Project Logic
- Page Action
- Project Tools
- Project Options
- Introduction to Project Options
- Conditional Auto Save
- Project Details
- Add Languages
- Question Sequence
- Anonymous Project
- Display Options
- Event Messages
- Save Survey Edit Later Option
- Save Responses Continuously
- Thank You Message
- Reopen Submitted Responses
- Use Chain Invitations to Share Surveys
- URL Redirect: Static and Dynamic
- Print Options
- Expiry Rules
- Switch Project Type
- Enhanced Participation
- Automatic Email Alerts
- Question Features
- Project Branding and URL Customization
- Project Customization
- Good to Know
- Distribute
- Introduction
- Publish Project
- Other Publishing Options
- Automated Distribution
- Invitation Templates
- Contact Lists
- Reminders
- Customizing Participation
- Good to Know
- Directory
- Participation
- Track
- Report
- Introduction to Reports
- Run a Report
- Omni All in One Report
- Text Analysis
- Frequency Reports
- Individual Responses
- Raw Data
- Special Reports
- Legacy Reports
- Charts and Graphs
- Save, Export, Share Reports
- Filter Manager
- Good to Know
- Custom Dashboard
- Introduction to Custom Dashboard
- Build Your Custom Dashboard
- Widgets
- Filter
- Segmentation
- Data Management
- Privacy And Compliance
- Integrations and API
- Account Administration
- Account Settings
- Account Settings
- Update Personal Information
- Update Company Information
- Account Notifications
- Review Account Usage
- Customize Survey Labels
- Project Allocation
- Linked Account
- View Product Details
- Referral Program
- Payment History
- Billing Information
- Two-Step Authentication
- Account Security
- Recent Account Activity
- Single Sign-On (SSO)
- Outbound Email Settings
- Compliance
- Email Settings
- Project Branding
- Manage Sub-Users
- Good to Know
- Billing
- Introduction
- Sign Up and Upgrade
- Acceptable Payment Methods
- Upgrade a Paid Account
- Payment Receipts
- Change Billing Information
- Upgrade Using Purchase Order
- Referral Benefits Program
- Sogolytics Plans
- Payment Methods Available
- Failed Payment
- Switch to Annual Billing
- Upgrade a Free Pro or Tral Account
- Sign Up for a Paid Account
- Sogolytics Standard Support
- Downgrade or Cancel Account
- Poll Project
- Good to Know
- FAQs
- Getting Started!
- Building CX Surveys
- CX Metrics
- CX Dashboard
- CX Dashboard Settings
- Analyze your drivers
- Good to know
- Getting Started
- Account Set-up
- Account Administration
- Introduction to Account Administration
- Managing Users
- User Groups
- Landing Pages
- Tab Editor
- Critical Alerts
- Enable Browser Based Notifications
- Customer Feedback Preferences
- Turn Emails into Dialogues
- Account Activity Log
- Define Dialogue Aging
- Create Tags
- Comparison Overview
- Raise a Dialogue with Sogolytics
- Safelisting
- Inbox
- Dialogues
- News
- SogoConnect Dashboard
- Campaigns
- Help
- Getting Started!
- Assessment Question types
- Score and more
- Quiz participation
- Get Results
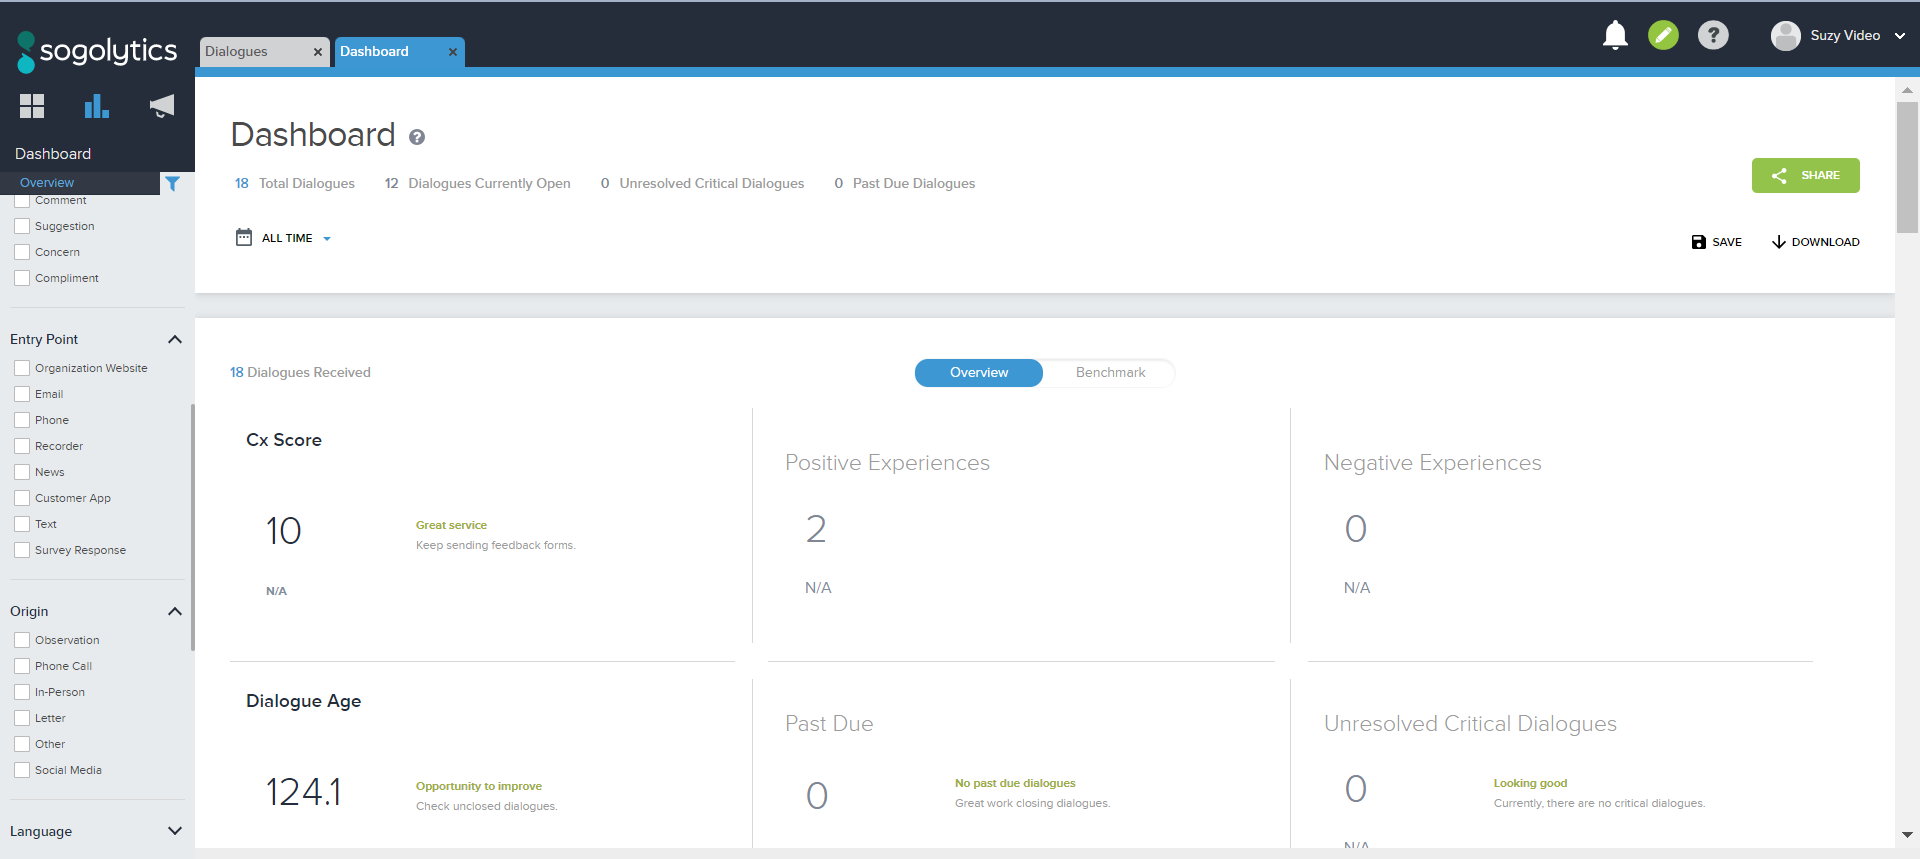
Let’s break down each section of the SogoConnect Dashboard.
Dialogue Overview
In the Dialogue Overview, you’ll see your organization’s overall CX score. If the individual who submitted the Dialogue leaves feedback once their Dialogue is resolved, you’ll see it here. You’ll see the number of Positive Experiences and Negative Experiences. If you want to dig deeper into the CX Score or the associated Positive and Negative Experiences, you can click on their square to open up their trends.
Below the CX Score, Positive Experiences, and Negative Experiences, you’ll see Dialogue Age, which dialogues are past due, and if there are any Unresolved Critical Dialogues.
If you click on the Dialogue Age square you’ll see the Dialogue Age Distribution and recent Dialogues. You can also click on the Past Due Dialogues and Unresolved Critical Dialogues.
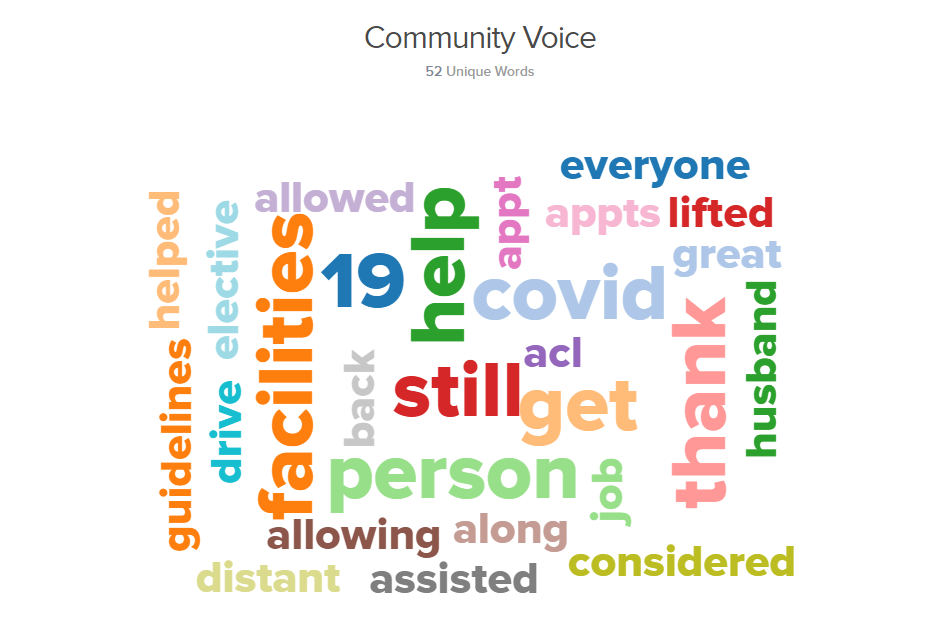
Community Voice
You’ll see a word cloud for the most frequently used words on all of your Dialogues. Below the word cloud you can view the top 10 words and the top critical words. If you click on any of the words in the word cloud, a new tab with all of the relevant dialogues will appear.
Dialogue Metrics
With Dialogue Metrics, you can see the percentage of Dialogues between Customer Types, Dialogue Types, Entry Points, and Customer Frequency.
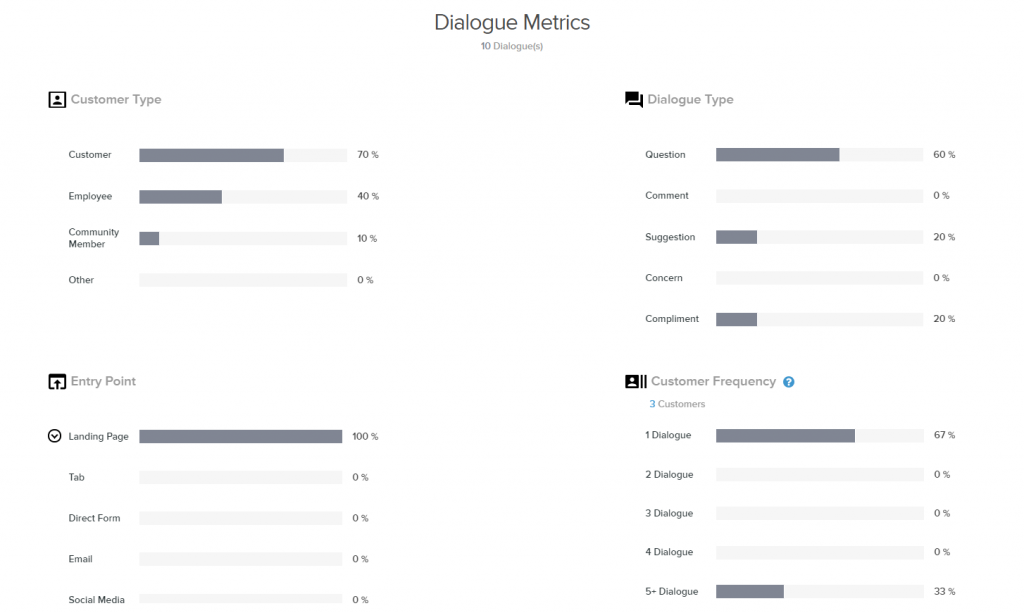
If you hover your cursor over any of the Dialogue Metric bars, you’ll be able to see that percentage further broken down by Interest Areas. If you want to go further and see all of these specific Dialogues, click on the bar to open a new Dialogue tab.
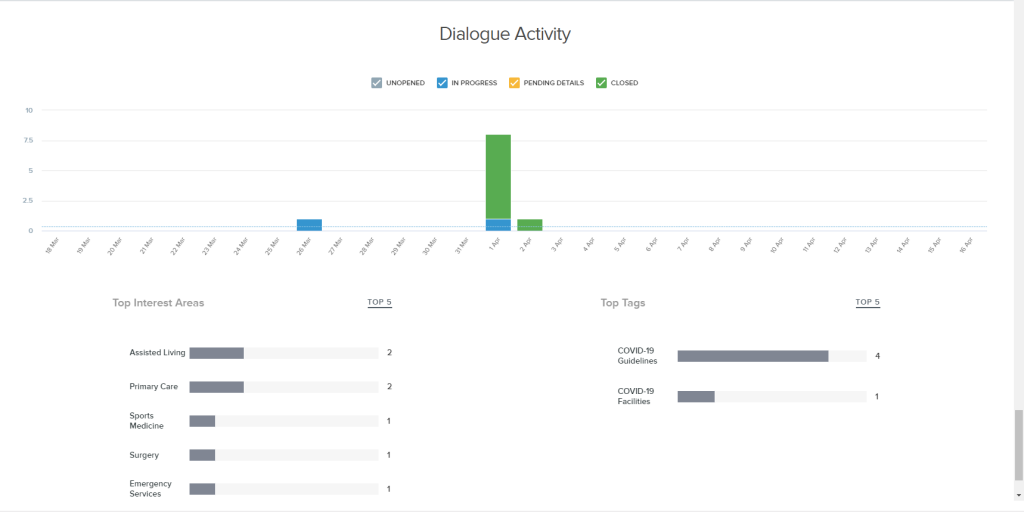
Dialogue Activity
With Dialogue Activity, you can get a day-by-day chart to see how many Dialogues you have received, and the Status of those Dialogues.
Subscribe for tips and insights to drive better decisions!