Introduction to Widgets
Widgets are the building blocks of a Custom Dashboard. Each widget displays a specific data point from a project and can be independently configured with its own data source, filters, and segmentation. Selecting the appropriate widget type ensures that the dashboard communicates insights effectively to its intended audience.
Widgets are accessible from the left panel of the Dashboard canvas. For placement instructions, refer to the individual widget-type articles. For post-placement configuration, refer to Widget Options.
Learn More About Widgets
Widget Types
The following widget types are available within Custom Dashboards:
Graph: Displays responses as dynamic charts (bar, line, pie, donut, and trend). Supports standard and grid question types with configurable trend analysis.
Table: Presents responses in a structured tabular format for side-by-side numeric comparisons across segments, locations, or roles.
Raw Responses: Displays complete participant records directly on the dashboard. Supports all question types (excluding Attachment and Signature) and includes drag-and-drop identifier management.
Description: Adds text-based content such as section headers, explanatory notes, or stakeholder instructions. This widget does not connect to a data source.
Score: Displays a single key metric prominently, based on rating scale or metric questions. Designed for high-visibility KPIs such as NPS, CSAT, or custom scores.
Cross Tab: Enables cross-tabulation between two variables to explore relationships that are not visible in single-variable views.
NLP: Provides AI-driven analysis of open-ended responses, including sentiment scores, sentiment trends over time, and word clouds that highlight key themes.
Widget Dimensions
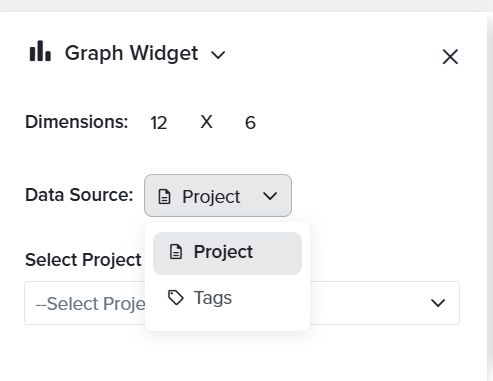
By default, all widgets have dimensions of 12 × 6, where 12 represents the width and 6 represents the height. You can adjust these dimensions either while adding a widget using the settings panel on the left or by dragging the edges of an existing widget on the canvas.
Widget Data Source
Projects serve as the default data source for widgets. Each widget connects to a single project and can display data from questions, metadata, or directory fields associated with that project.
Different widgets on the same dashboard can connect to different projects, allowing you to consolidate data from multiple surveys, CX studies, EX studies, and assessments into a single view.
For CX and EX projects, widgets can also use Tags as a data source to surface insights organized by touchpoint, product, department, or other tag categories. If Tags have been applied to metric and driver questions in the source project, the widget inherits that structure, enabling tagged insights to be displayed without additional configuration.
Subscribe for tips and insights to drive better decisions!