NLP Widget
The NLP Widget uses AI-driven natural language processing to analyze open-ended survey responses and deliver structured insights directly within your Custom Dashboard. It identifies sentiment, key themes, emotional patterns, and keyword frequencies—transforming unstructured text into clear, actionable visual summaries without the need for manual coding or external tools.
Adding an NLP Widget
To add an NLP Widget to your Custom Dashboard, follow the steps mentioned below:
- From the widget selection panel, drag the NLP Widget onto the dashboard canvas.
- Under Data Source, select the source from which the widget will analyze responses. The following options are available:
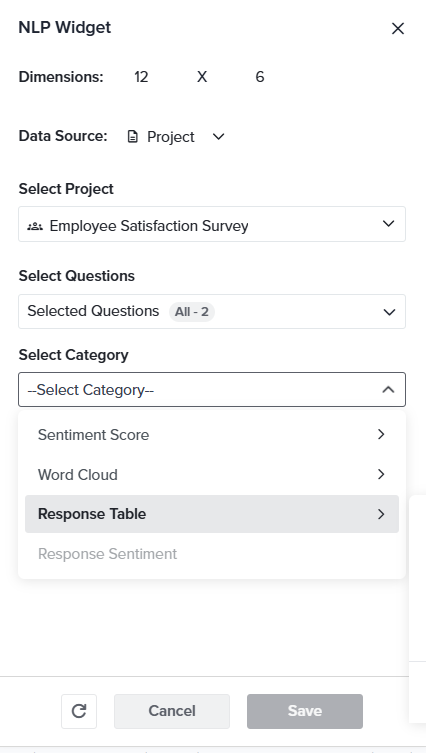
- Project – Analyzes open-ended responses from a single project. Select the target project from the Select Project dropdown. This is the default data source.
- Tags – Analyzes open-ended responses across every project that shares one or more selected tags. Select the target tags from the Select Tags dropdown. Use this option to consolidate qualitative feedback from multiple projects — for example, all surveys tagged Post-Discharge or Onboarding — into a single NLP analysis.
- Under Select Questions, choose one or more open-ended questions to analyze.
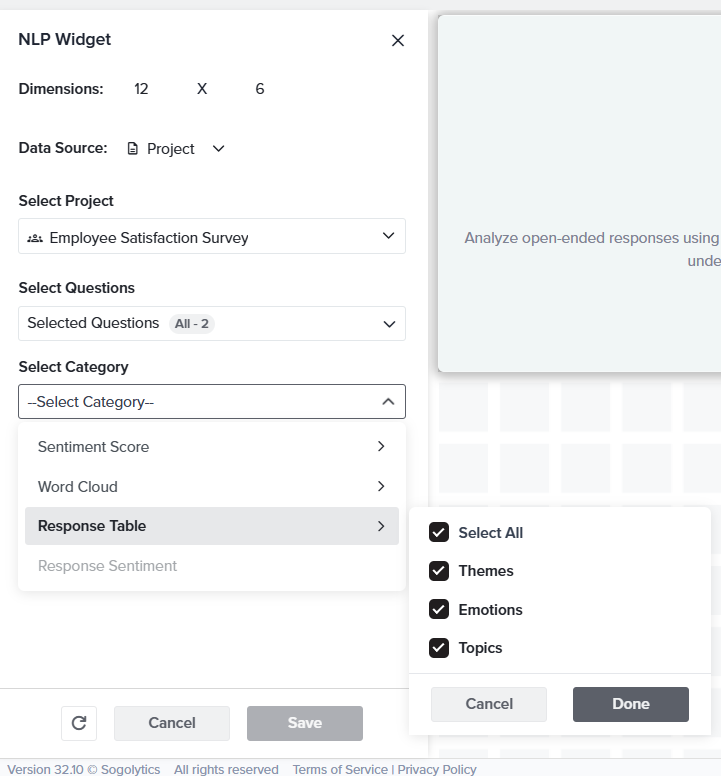
- From the Select Category dropdown, choose the analysis type to display. Refer to the Analysis Categories section below for a description of each option.
- The Title field auto-populates based on the selected category. Modify it to apply a custom title if required.
- Configure the Data Display format and Advanced Settings as described in the sections below.
- Click Save to apply the configuration.
The NLP Widget requires text-based (open-ended) questions. Closed-ended question types, such as Rating scales, are not supported.
&nsbp;
Analysis Categories
The Select Category dropdown determines the type of NLP analysis rendered by the widget. The following categories are available:
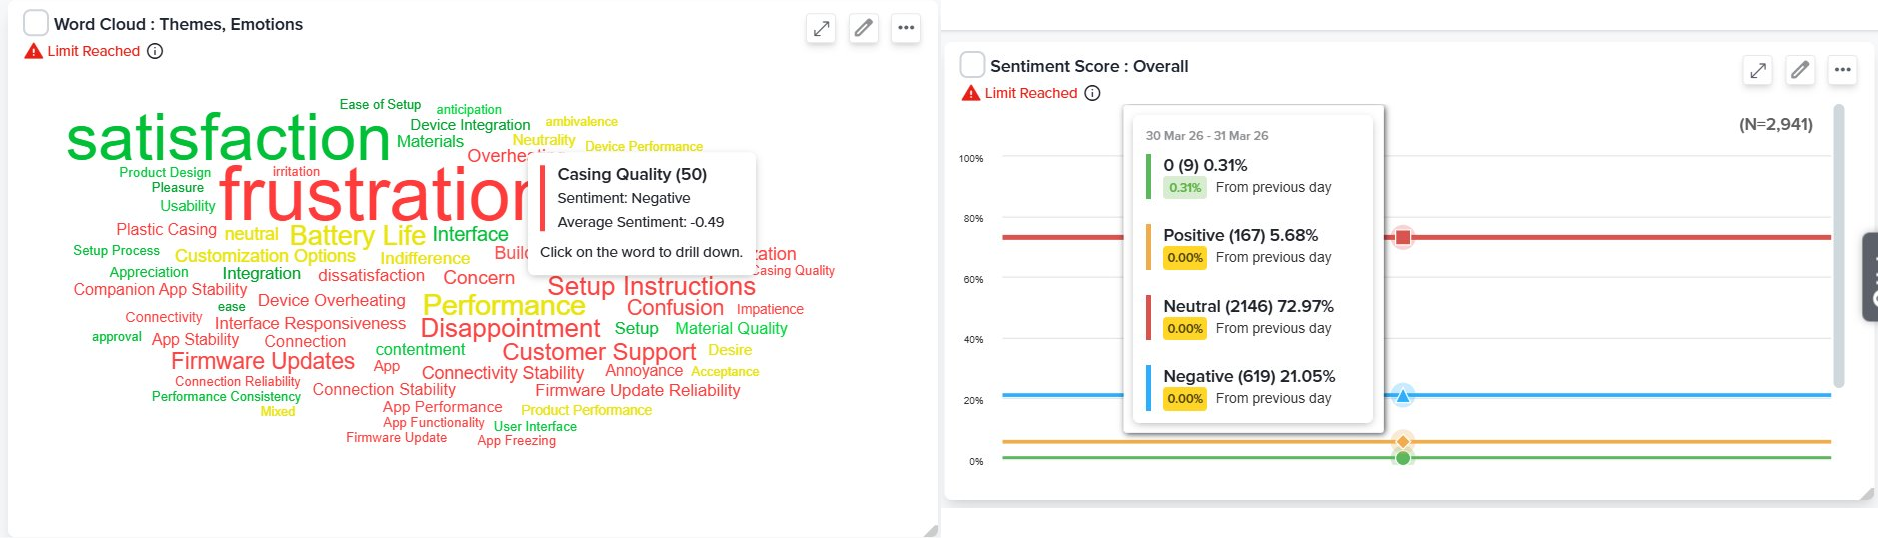
- Sentiment Score: Overall – Renders an aggregate sentiment score derived from all selected open-ended responses, reflecting the overall positive, negative, or neutral tone across the data set.
- Word Cloud – Generates a visual representation of the most frequently occurring terms in the responses. The following sub-categories can be selected:
- Themes – Dominant topics extracted from the response text.
- Emotions – Emotional patterns identified across responses.
- Themes, Emotions – A combined view displaying both themes and emotions.
- Response Table – Presents individual responses in a structured table, with each row displaying the response text alongside its assigned sentiment classification, themes, and emotion labels.
Data Display
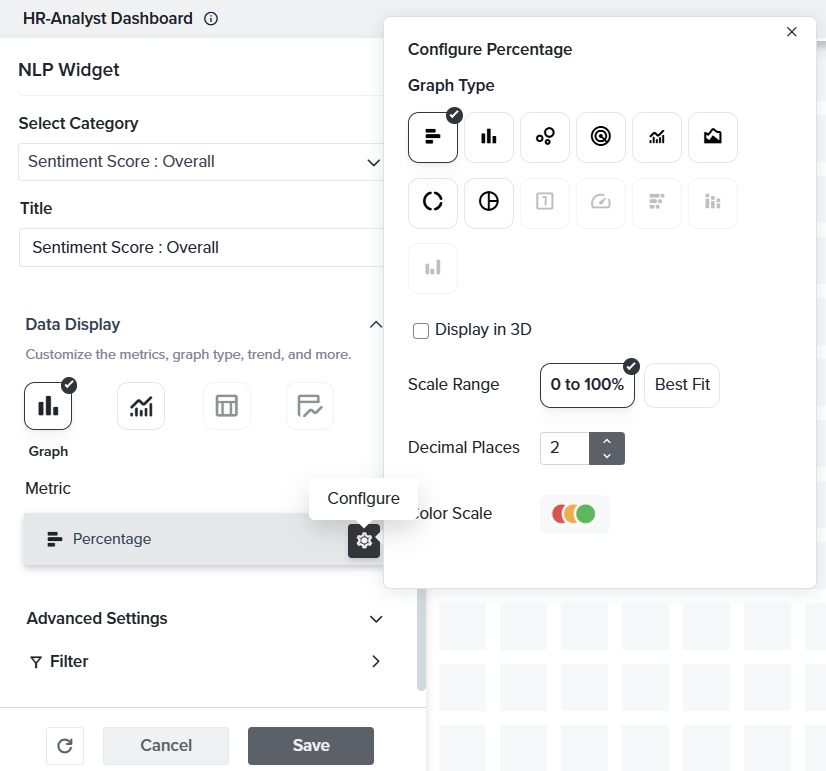
The Data Display section controls how the NLP analysis is rendered visually. Available display types vary based on the selected category:
- Graph – Bar chart rendering sentiment distribution or theme/emotion frequency.
- Trend Graph – Line chart tracking sentiment or theme trends over time. Trend frequency and calculation method are configurable under Advanced Settings.
- Table – Structured tabular view with response-level detail.
Under Metric, select the calculation method for the display—the default is Percentage. Click the gear icon next to the metric to configure decimal places and additional display settings, such as scale range and color scale. You can also choose to display the graph in 3D.
Advanced Settings
The following configuration options are available under Advanced Settings:
- Sort By – Define the ordering of data points (by value, alphabetical, or order of appearance).
- Legend Position – Specify the placement of the chart legend (top, bottom, left, right, or hidden).
- Frequency – For Trend Graph displays, define the time interval for data aggregation (daily, weekly, monthly, quarterly, or yearly).
- Calculation – For Trend Graph displays, select the aggregation method applied to each interval.
- Include ‘Incomplete Responses’ – When enabled, partial submissions are included in the NLP analysis. Disabled by default.
- Show ‘Total Responses’ – When enabled, the total response count is displayed on the widget. Enabled by default.
Widget-level filters can be applied to narrow the set of responses included in the NLP analysis.
Subscribe for tips and insights to drive better decisions!