Score Widget
The Score Widget consolidates rating and metric questions into a single summary value on your Custom Dashboard. It is designed to present headline metrics — such as a CSAT average, an NPS score, or the weighted score of a rating scale — enabling stakeholders to assess project performance at a glance, without reviewing individual responses.
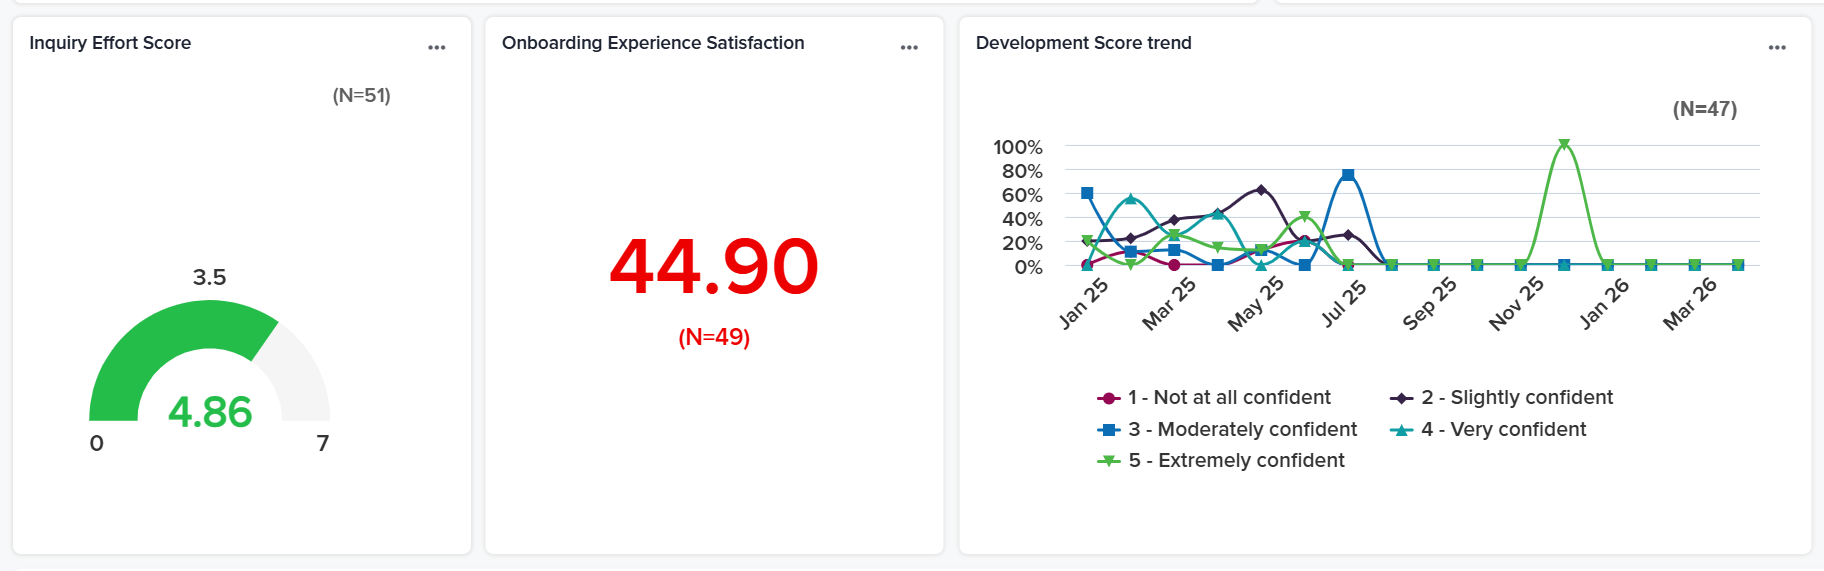
Based on its configuration, a single Score Widget can display one cumulative score, a breakdown across multiple questions, or comparative scores for a group of related rating questions.
Navigate to
- Adding a Score Widget
- Supported Question Types
- Supported Metadata
- Metric Format
- Advanced Settings
- Best Practices
Adding a Score Widget
To add a Score Widget to your Custom Dashboard, complete the following steps:
- From the widget selection panel, drag the Score widget onto the dashboard canvas.
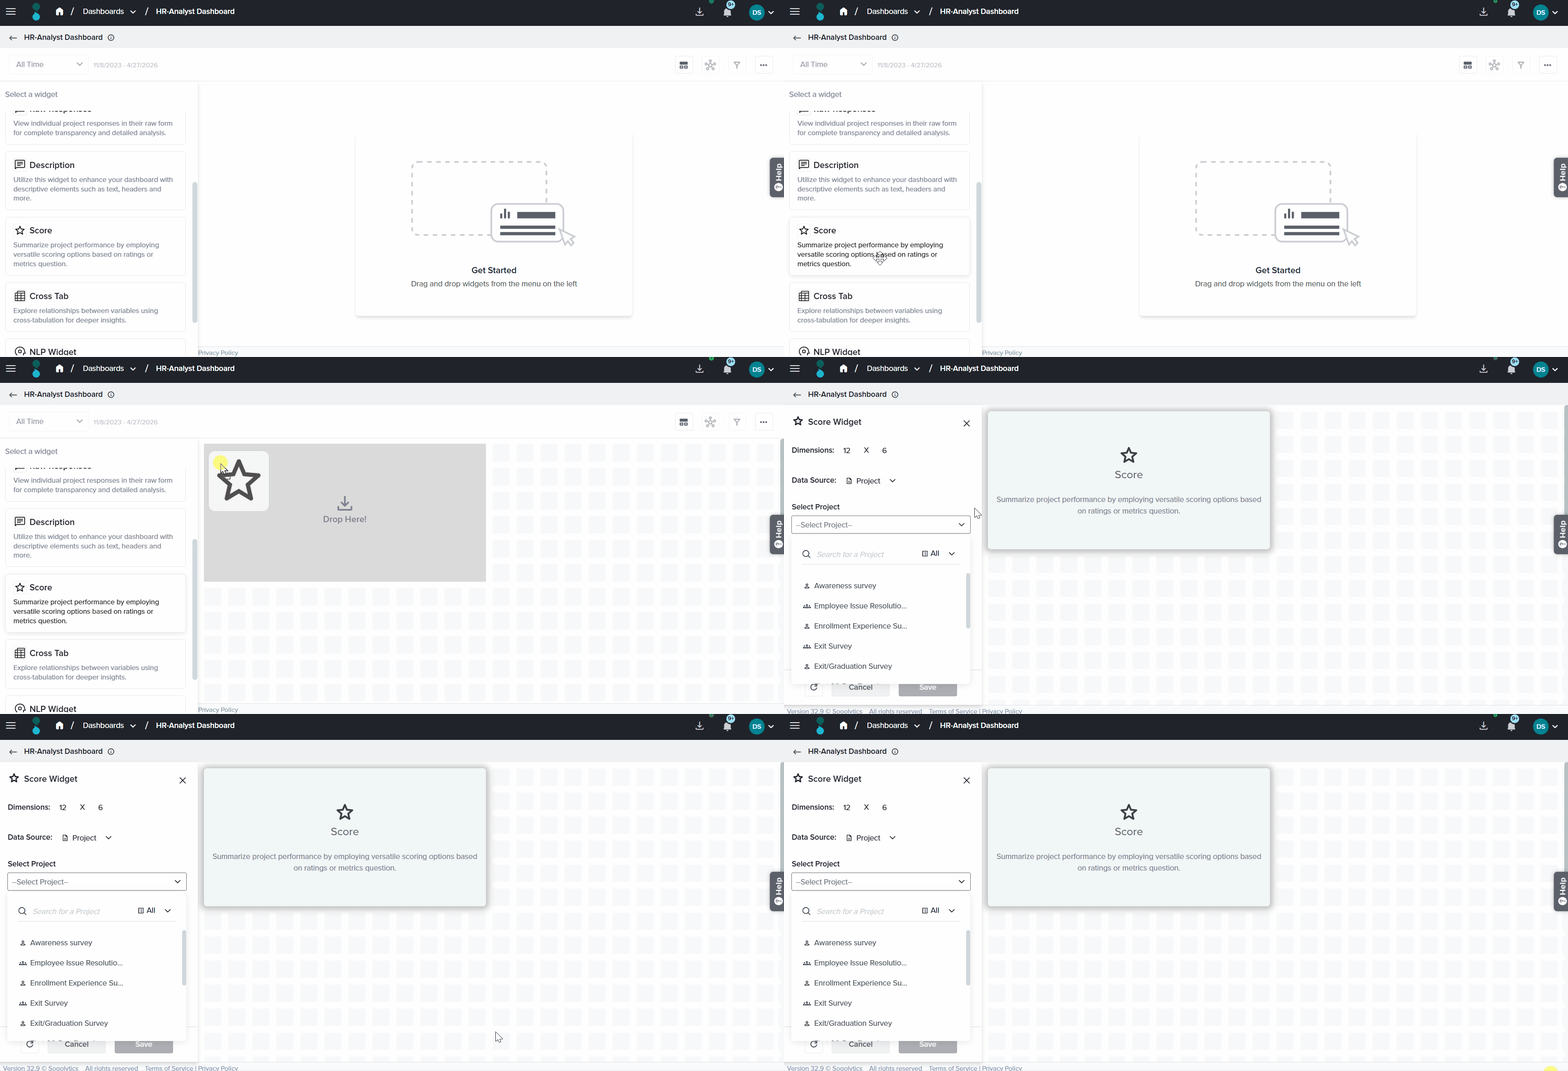
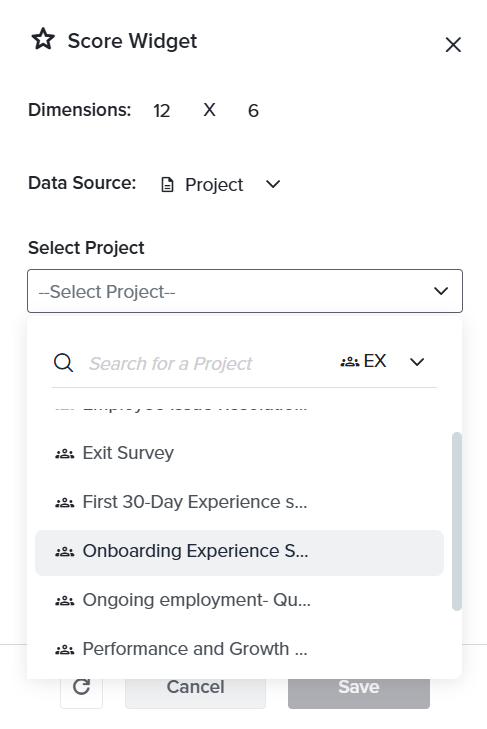
- Select the target project from the Select Project dropdown. This dropdown opens by default when the widget is placed.
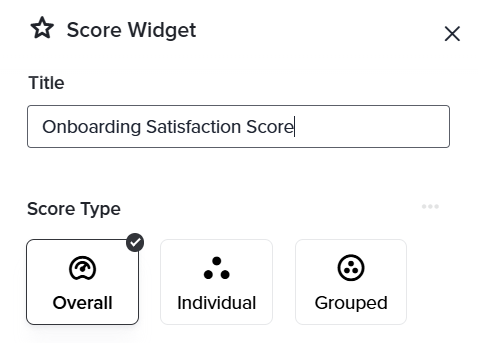
- Choose a Score Type to determine how the widget aggregates the selected questions. Three options are available:
- Overall – Combines all selected rating questions into a single cumulative value. Recommended when a single headline number is required to represent overall performance, for example, a consolidated satisfaction score derived from multiple CSAT questions.
- Individual – Displays the weighted score for each selected rating question in a separate graph. Recommended when individual questions need to be compared rather than aggregated.
- Grouped – Renders a separate graph for each rating question in the project. Recommended for a quick visual overview of performance across all rating questions without configuring each one individually.
- Use Select Questions to choose which rating questions from the project feed the score.
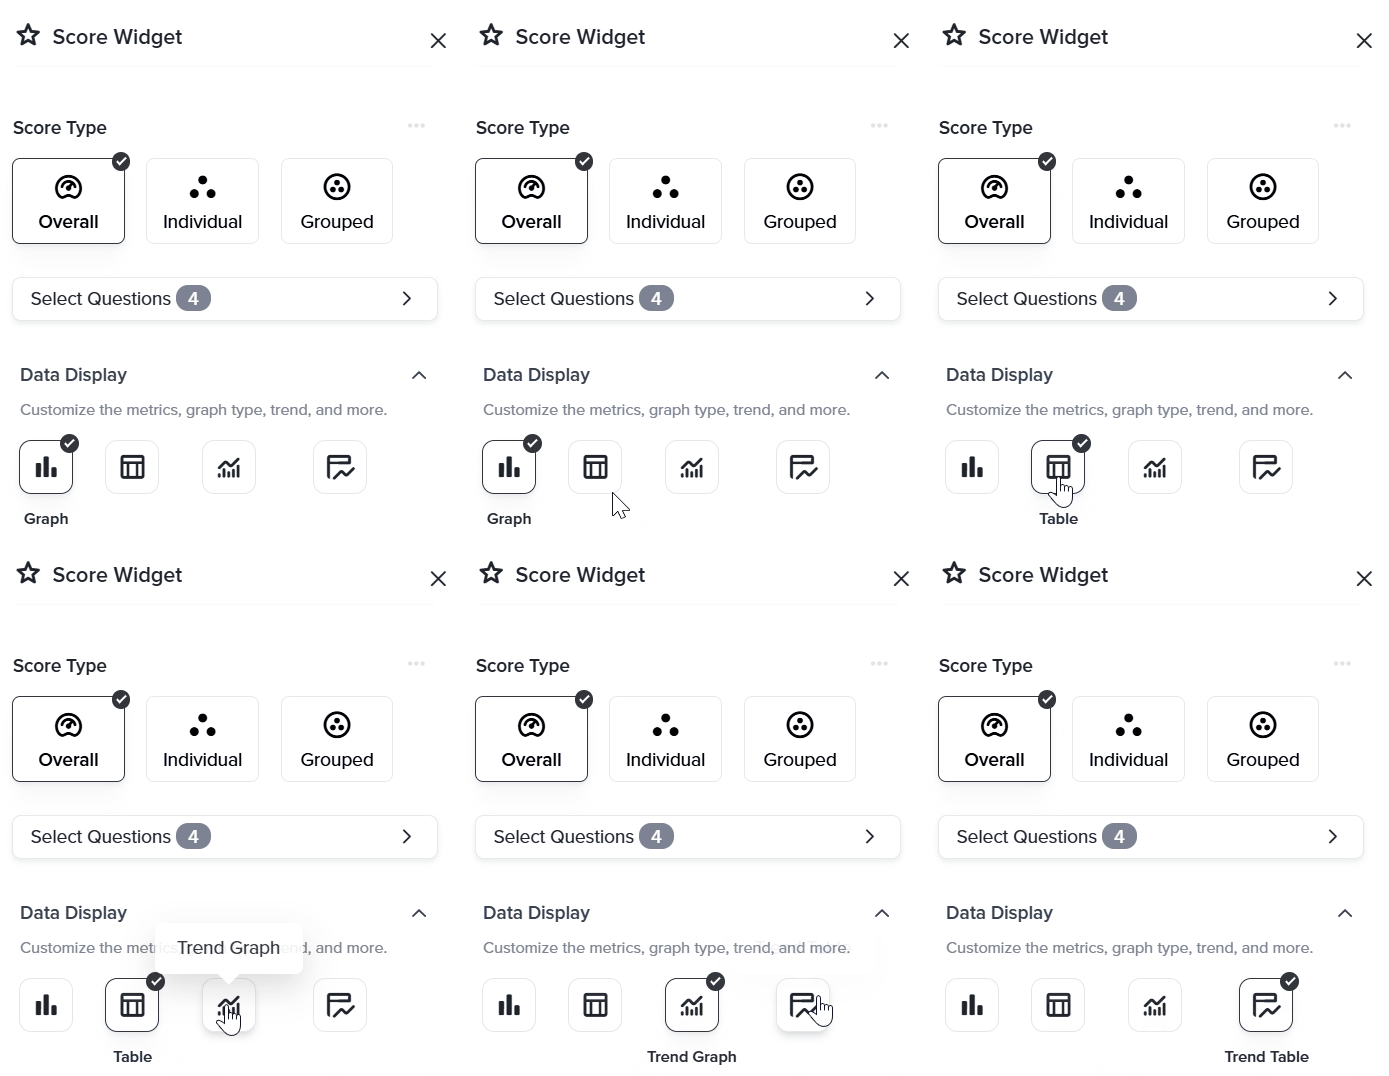
- Select a Data Display format to determine how the score is presented:
- Graph – A visual gauge or chart representation of the score. Recommended for dashboards intended for at-a-glance review.
- Table – A tabular layout presenting the score alongside its supporting values. Recommended when precise numeric values are required.
- Trend Graph – A time-series visualisation of the score plotted over a selected period. Recommended when tracking how a metric changes across survey cycles, response periods, or date ranges.
- Trend Table – A tabular layout presenting score values across time periods in rows and columns. Recommended when precise numeric comparison across periods is required rather than a visual representation.
- Select a Metric Format to define the specific value the widget calculates and displays. Refer to the Metric Format section below for details on available options.
- Configure Advanced Settings, Filters, and Segmentation as required.
- Click Save to apply the configuration.
A customer experience manager needs to compare satisfaction performance across three CSAT questions on a single dashboard panel. By selecting Individual as the Score Type, each question renders as a separate graph within the widget, making side-by-side comparison straightforward without building three separate widgets.
Supported Question Types
The Score Widget supports question types that generate a numeric rating or score. The following question types can be used as a data source:
- CSAT – Customer Satisfaction rating question.
- CES – Customer Effort Score question.
- Key Driver Analysis – Rating questions tagged as key drivers in the project.
- Rating Scale – Single-row rating on a defined scale (e.g., 1–5, 1–10).
- Rating Radio Grid – Grid of rating items answered via radio buttons.
- Rating Drop Down Grid – Grid of rating items answered via drop-downs.
- Rating Scale Grid – Grid where each row uses a rating scale.
- Rating Drop Down – Single rating question answered from a drop-down list.
Open-ended text, non-rating single-select, and ranking question types are not supported. If an expected question is not available during widget configuration, confirm that it belongs to one of the supported types listed above.
Supported Metadata
In addition to question-level data, the Score Widget can display the following project-level metadata:
- Time to complete the survey – The average time respondents spent completing the survey.
- Channel – The distribution channel through which each participant accessed the survey, such as email, link, SMS, or QR code.
- Response rate – The percentage of invited participants who submitted a response.
- Participation trend – Changes in participation volume over time.
Metric Format
Metric Format defines the specific value the widget calculates and displays. Select the format that corresponds to the question type and the reporting requirement:
| Metric | Description |
| Percentage | The proportion of responses that fall into each rating option, expressed as a percentage of total responses. |
| Response Count | The total number of responses received for the selected question or questions. |
| Weighted Score | The average score, calculated by weighting each rating option by the number of responses it received. Recommended for standard rating scales. |
| Weighted Score as Percentage | The weighted score expressed as a percentage of the maximum possible score. Useful when comparing scales with different ranges on the same dashboard. |
| Net Intent | A net-score calculation based on the percentage of favorable responses minus the percentage of unfavorable responses. Commonly used for NPS-style metrics. |
| Percent Favorable | The percentage of respondents who selected a favorable option, typically the top ratings on the scale. Recommended for top-box reporting. |
If the appropriate metric is unclear, Weighted Score is a suitable starting point for standard rating scales, and Percent Favorable is recommended for top-box reporting. The metric can be changed at any time without rebuilding the widget.
Advanced Settings
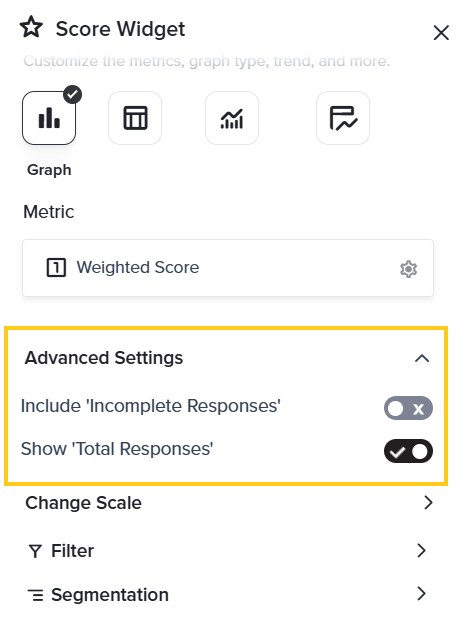
Advanced Settings provide additional control over how responses are counted in the widget. Expand this section during widget configuration to access the following options:
- Include ‘Incomplete Responses’ – When enabled, the widget includes responses from participants who answered the question but did not complete the full survey. Enabling this option typically increases the response count; when disabled, the score reflects completed responses only.
- Show ‘Total Responses’ – When enabled, the widget displays the total number of responses (N) alongside the score.
Subscribe for tips and insights to drive better decisions!