Trusted by leading school districts nationwide







Measurement Capabilities
What our climate survey measures
Relationships among students, staff, and families
Belonging and identity
Support and instructional climate
Communication
between the school, the home, and the community
Perception gaps across groups,
including student versus staff, elementary versus secondary, family language, race, and program participation
Data Context & Validity
How your results compare
Our climate instrument benchmarks against 17 K-12 districts in the 2025-2026 school year alone, with data collected on the same items across public districts, charter networks, and private school networks.
A single district reading tells you where you sit. A benchmarked reading tells you where you sit compared to districts that look like yours.
Download the benchmarking guide arrow_forwardSogolytics K-12 Benchmarking Database
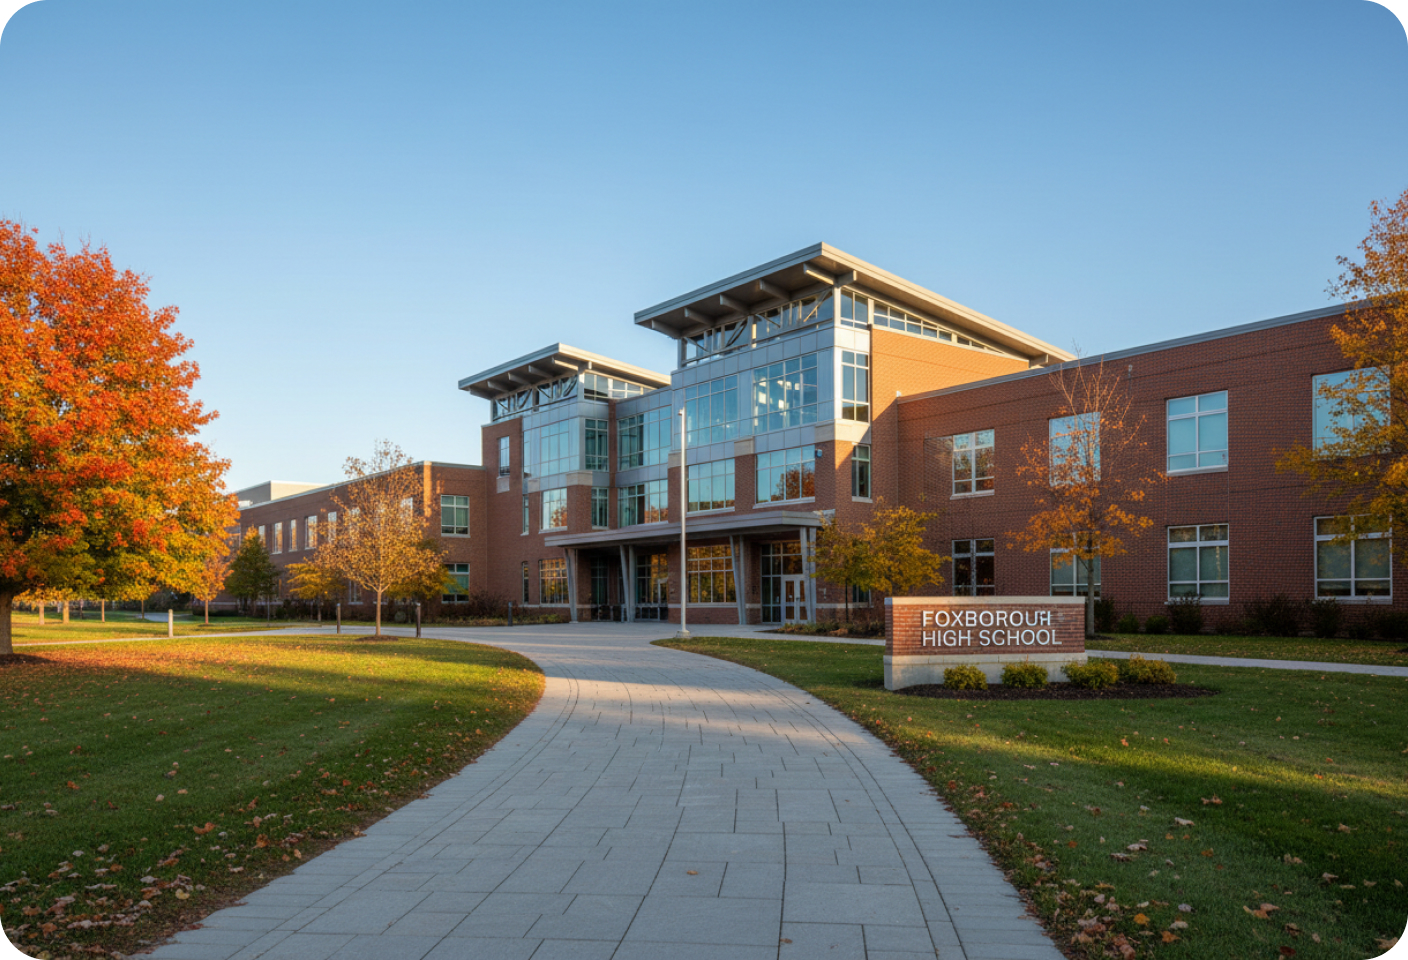
Case Study: District in Focus
What acting on the data looked like in Foxborough
The district ran our climate survey year over year, acted on what students said about safety, and saw a 14-point increase in student perception of school safety on the same items the following year. The board saw the number.
The community saw the response. The staff saw the follow-through. Foxborough is one story, and the point of a benchmarked survey program is to make that story repeatable.
Read the Foxborough climate story arrow_forward
Methodology Deep DiveSchool climate survey questions for students:
School climate survey questions for students:
what to ask and why
Below are sample items in each of the five core diagnostic domains, detailing the validated psychometric rationale behind each formulation.
1. Safety Domain
I feel safe at school. Anchor item, validated in K-12 climate research since the mid-2000s. The word safe is deliberately broad. We let students name what they mean in an open-ended follow-up.
There is an adult at school I can go to if I do not feel safe. Names the mechanism, not just the feeling.

2. Belonging Domain
There is an adult at school who knows me well. Belonging is measured through relationship items, not through the word belonging itself, which younger students read unevenly.
Students at my school are kind to each other. Peer belonging, not just student-to-adult belonging.
3. Relationships Domain
My teachers care about me as a person. The word care is the load-bearing word. We have tested alternatives and this one holds.
When I make a mistake, my teachers help me learn from it. Relational trust in the context of correction, which is where the trust actually gets tested.


4. Support Domain
I get help at school when I need it. Support in the student's terms.
There is at least one class where I feel challenged in a good way. Instructional climate without a proxy word an eighth-grader would not use.
5. Communication Domain
My school tells my family what is going on. Family-school communication as the student experiences it.
I know what to do if I want to give my school feedback. Voice as a mechanism, not just a feeling.
"The instrument is only part of the work. What separates a defensible climate report from a good-looking one is the sampling behind it, the response rate we hit across every group, and the reporting we hand your board. Those are ours."
The three needs we hear most
“My teachers are leaving and I need to know why while there is still time to act.”
“The board wants an honest read on climate, safety, and community trust.”
“A new strategic plan starts soon and no one has asked the community what they think.”
Curated District Insights
Ready to get started?
Partner with our specialized K-12 research division. Get school climate benchmarking backed by deep statistical rigor and defensible board compliance standards.
FAQs about K-12 school climate surveys
What do K-12 school climate surveys measure?
add_2 removeStart with the item every board asks about: do students feel safe? From there it covers belonging, relationships with adults, support in class and how well the school talks to families. The gaps are often the story, say ninth graders rating safety twenty points below their teachers.
Why should school districts conduct school climate surveys?
add_2 removeBecause you’ll be asked to report on climate anyway, and boards want a number they believe. A good survey also tells you what to fix. Foxborough acted on what students said about safety and saw a 14-point jump in perceived safety the next year.
How can school climate survey results help identify differences between schools?
add_2 removeEvery school gets its own results, so differences jump out. Say one middle school climbs eight points while the one across town drops on the same questions. You’d send help to the second school instead of mailing the same fix to all of them.
What is the value of benchmarking K-12 school climate survey results?
add_2 removeA district score alone tells you where you sit. A benchmark tells you whether that’s good for a district like yours. Ours uses the same items across public districts, charter networks and private school networks, so you’re comparing like with like.
