


Please enter at least three characters for your search.
Open Menu
Project Basics
- Getting Started!
- Building EX Surveys
- EX Metrics
- EX Dashboard
- EX Dashboard Settings
- Analyze your drivers
- Good to know
- Getting Started!
- Why Sogolytics
- Getting Started with Sogolytics
- Tour
- Home
- Verify My Account
- Account Creation
- Introduction to Packages
- Mobile App
- Design
- Introduction to Project Design
- Project Types
- Create a Project
- Question Types
- Question Types
- Add a Question
- Mobile Friendly Questions
- Edit a Question
- Introduction to Simple Question Types
- Introduction to Grid Questions
- Horizontal Radio Button
- Descriptive Text
- Text Box
- Radio Button (Single-Select)
- Drop Down
- Check Box (Multi-Select)
- Demographic
- Rating Scale
- Symbol Rating Scale
- Like/Dislike
- Ranking
- Date
- Image Choice
- Net Promoter Score (NPS)
- Multiple Text Box
- Multiple Drop Down
- Radio Grid
- Check Box Grid
- Rating Radio Grid
- Rating Drop Down Grid
- Rating Scale Grid
- Matrix Grid
- Advanced Questions and Elements
- Page Break
- Captcha
- List Box
- Rating Drop Down
- Rating Radio Button
- Attachment
- Numeric Allocation
- Drill-Down
- Signature
- Re-use Questions and Answers
- Advanced Design Options
- Project Logic
- Page Action
- Project Tools
- Project Options
- Introduction to Project Options
- Conditional Auto Save
- Project Details
- Add Languages
- Question Sequence
- Anonymous Project
- Display Options
- Event Messages
- Save Survey Edit Later Option
- Save Responses Continuously
- Thank You Message
- Reopen Submitted Responses
- Use Chain Invitations to Share Surveys
- URL Redirect: Static and Dynamic
- Print Options
- Expiry Rules
- Switch Project Type
- Enhanced Participation
- Automatic Email Alerts
- Question Features
- Project Branding and URL Customization
- Project Customization
- Good to Know
- Distribute
- Introduction
- Publish Project
- Other Publishing Options
- Automated Distribution
- Invitation Templates
- Contact Lists
- Reminders
- Customizing Participation
- Good to Know
- Directory
- Participation
- Track
- Report
- Introduction to Reports
- Run a Report
- Omni All in One Report
- Text Analysis
- Frequency Reports
- Individual Responses
- Raw Data
- Special Reports
- Legacy Reports
- Charts and Graphs
- Save, Export, Share Reports
- Filter Manager
- Good to Know
- Custom Dashboard
- Introduction to Custom Dashboard
- Build Your Custom Dashboard
- Widgets
- Filter
- Segmentation
- Data Management
- Privacy And Compliance
- Integrations and API
- Account Administration
- Account Settings
- Account Settings
- Update Personal Information
- Update Company Information
- Account Notifications
- Review Account Usage
- Customize Survey Labels
- Project Allocation
- Linked Account
- View Product Details
- Referral Program
- Payment History
- Billing Information
- Two-Step Authentication
- Account Security
- Recent Account Activity
- Single Sign-On (SSO)
- Outbound Email Settings
- Compliance
- Email Settings
- Project Branding
- Manage Sub-Users
- Good to Know
- Billing
- Introduction
- Sign Up and Upgrade
- Acceptable Payment Methods
- Upgrade a Paid Account
- Payment Receipts
- Change Billing Information
- Upgrade Using Purchase Order
- Referral Benefits Program
- Sogolytics Plans
- Payment Methods Available
- Failed Payment
- Switch to Annual Billing
- Upgrade a Free Pro or Tral Account
- Sign Up for a Paid Account
- Sogolytics Standard Support
- Downgrade or Cancel Account
- Poll Project
- Good to Know
- FAQs
- Getting Started!
- Building CX Surveys
- CX Metrics
- CX Dashboard
- CX Dashboard Settings
- Analyze your drivers
- Good to know
- Getting Started
- Account Set-up
- Account Administration
- Introduction to Account Administration
- Managing Users
- User Groups
- Landing Pages
- Tab Editor
- Critical Alerts
- Enable Browser Based Notifications
- Customer Feedback Preferences
- Turn Emails into Dialogues
- Account Activity Log
- Define Dialogue Aging
- Create Tags
- Comparison Overview
- Raise a Dialogue with Sogolytics
- Safelisting
- Inbox
- Dialogues
- News
- SogoConnect Dashboard
- Campaigns
- Help
- Getting Started!
- Assessment Question types
- Score and more
- Quiz participation
- Get Results
It’s easy to quickly apply key choices to your entire report through the options under Overall Report Settings.
Click on the Overall Report Settings icon in the top right of your screen to update display preferences, then navigate through menus for questions, answer options, and graphs.
Questions
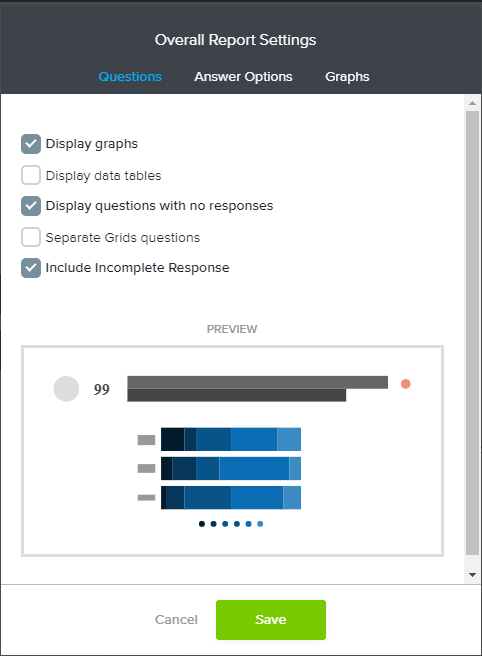
- Display graphs: Check/uncheck to show/hide all graphs in the report
- Display data tables: Check/uncheck to show/hide all data tables in the report
- Display questions with no responses: Check/uncheck to show/hide any question that has not received responses
- Display grid sub-questions separately: Check/uncheck to present grid sub-questions individually or together
- Include Incomplete Responses: Choose to include incomplete responses in the analysis.
Answer options
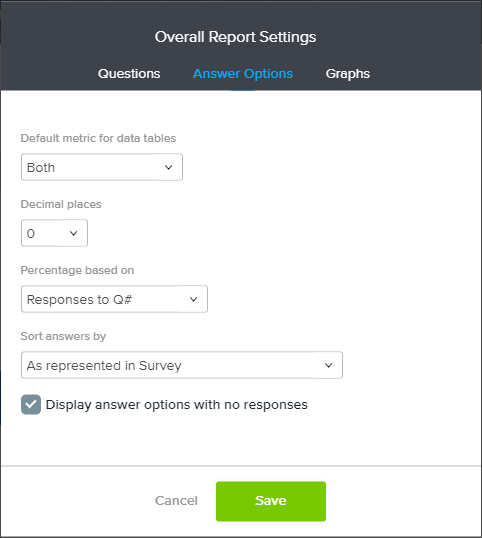
- Default metric for data tables: Within data tables, display count, percentage of responses, or both
- Decimal places: Calculate and display report results to the number of decimal places chosen here (0-2)
- Percentage based on: Calculate response percentages based on responses to the given question or the total number of survey responses
- Sort answers: Display answer options as shown in the survey, forward or backward alphabetical order, or from lowest or highest percentage
- Display answer options with no responses: Check/uncheck to show/hide any answer option that has not received responses
Graphs:
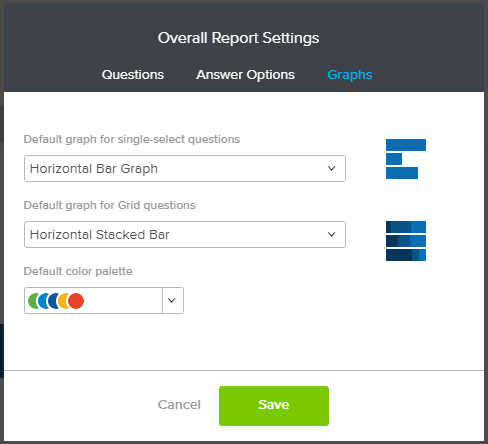
- Default graph for single-select questions: Set a standard graph type for all single-select questions
- Default graph for grid questions: Set a standard graph type for all grid questions
- Default color palette: Set your preferred color palette for all graphs
Once selections have been made, click Save to confirm your choices.
Love it when you
know more?
Subscribe for tips and insights to drive better decisions!

Thank you!
Your request has been successfully submitted.
