
For a fintech brand, opening an account is the first real test. It is where someone decides whether your product feels safe and simple, or slow and confusing. Most of them decide before they have tried a single feature. When it goes well, a curious visitor turns into a funded, active customer. When it goes badly, they leave, and most of them never tell you what went wrong.
Onboarding rarely falls apart in one big moment. It leaks. A little friction here, a small delay there, and the losses pile up until they show up weeks later in a completion report, long after the customer is gone. By then you know something is broken, but you cannot see where, or why.
This article looks at account opening as a funnel with five weak spots. Each one has a warning sign you can spot, a number that reveals it, and a fix that is usually smaller than teams expect. Teams that fix onboarding tend to share one habit. They watch each step as it happens, instead of asking customers about it weeks later. That way they can see exactly where people slip away.


Where Onboarding Really Slips
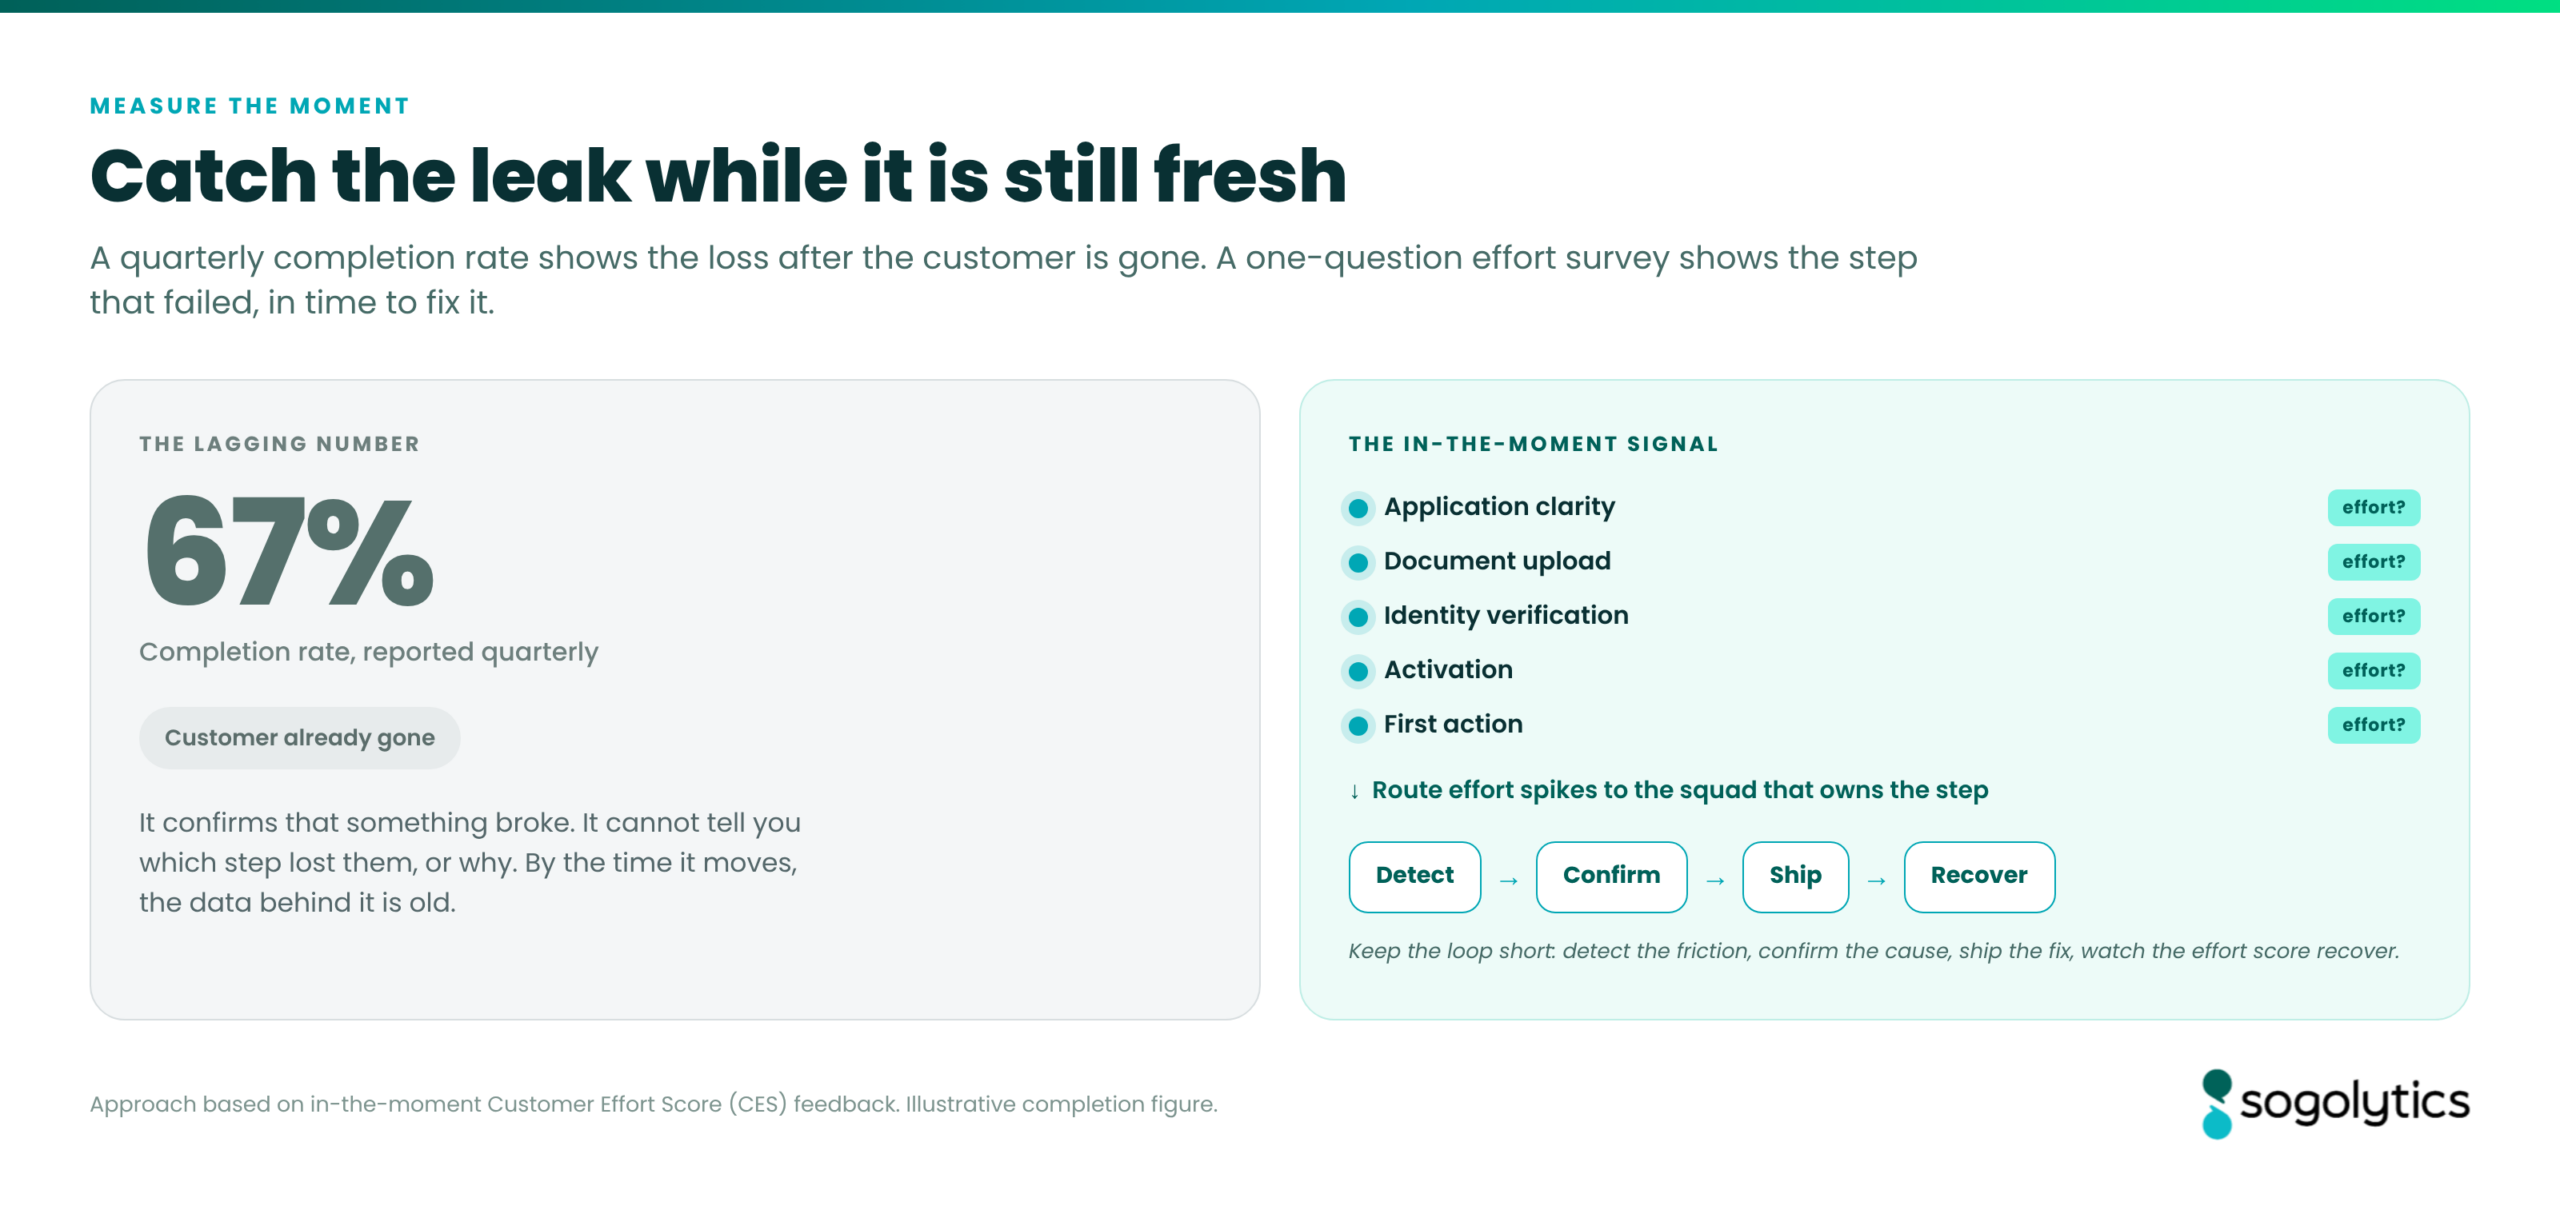
Most teams track onboarding with one number: the completion rate. It is a useful summary, but a late one. It tells you a customer gave up only after they have already gone. By then the real question, which step lost them, is hard to answer from your funnel charts alone. Those charts show where people stopped clicking, but not why.
Say a customer drops off at the document upload step. Maybe the system rejected a photo that was perfectly fine. Maybe the instructions were unclear. Or maybe an earlier identity check had already worn out their patience, and the upload was just the last straw. Click data cannot tell these apart. Feedback tied to the exact moment can. That is why measuring how much effort each step takes has become the practical way to diagnose onboarding.
Cross-industry research backs this up. The Sogolytics Experience Quarterly Index, Customer Edition Q3 2026, surveyed 1,001 U.S. consumers across nine industries. When people described a recent bad experience, two problems tied for the top spot: poor communication and long waits, each named by 34 percent. Hidden fees or misleading information came next at 28 percent, and unclear or confusing processes at 22 percent. These are cross-industry numbers, not fintech alone, but each one maps onto a step in account opening.
The Five Breakpoints Where Onboarding Leaks
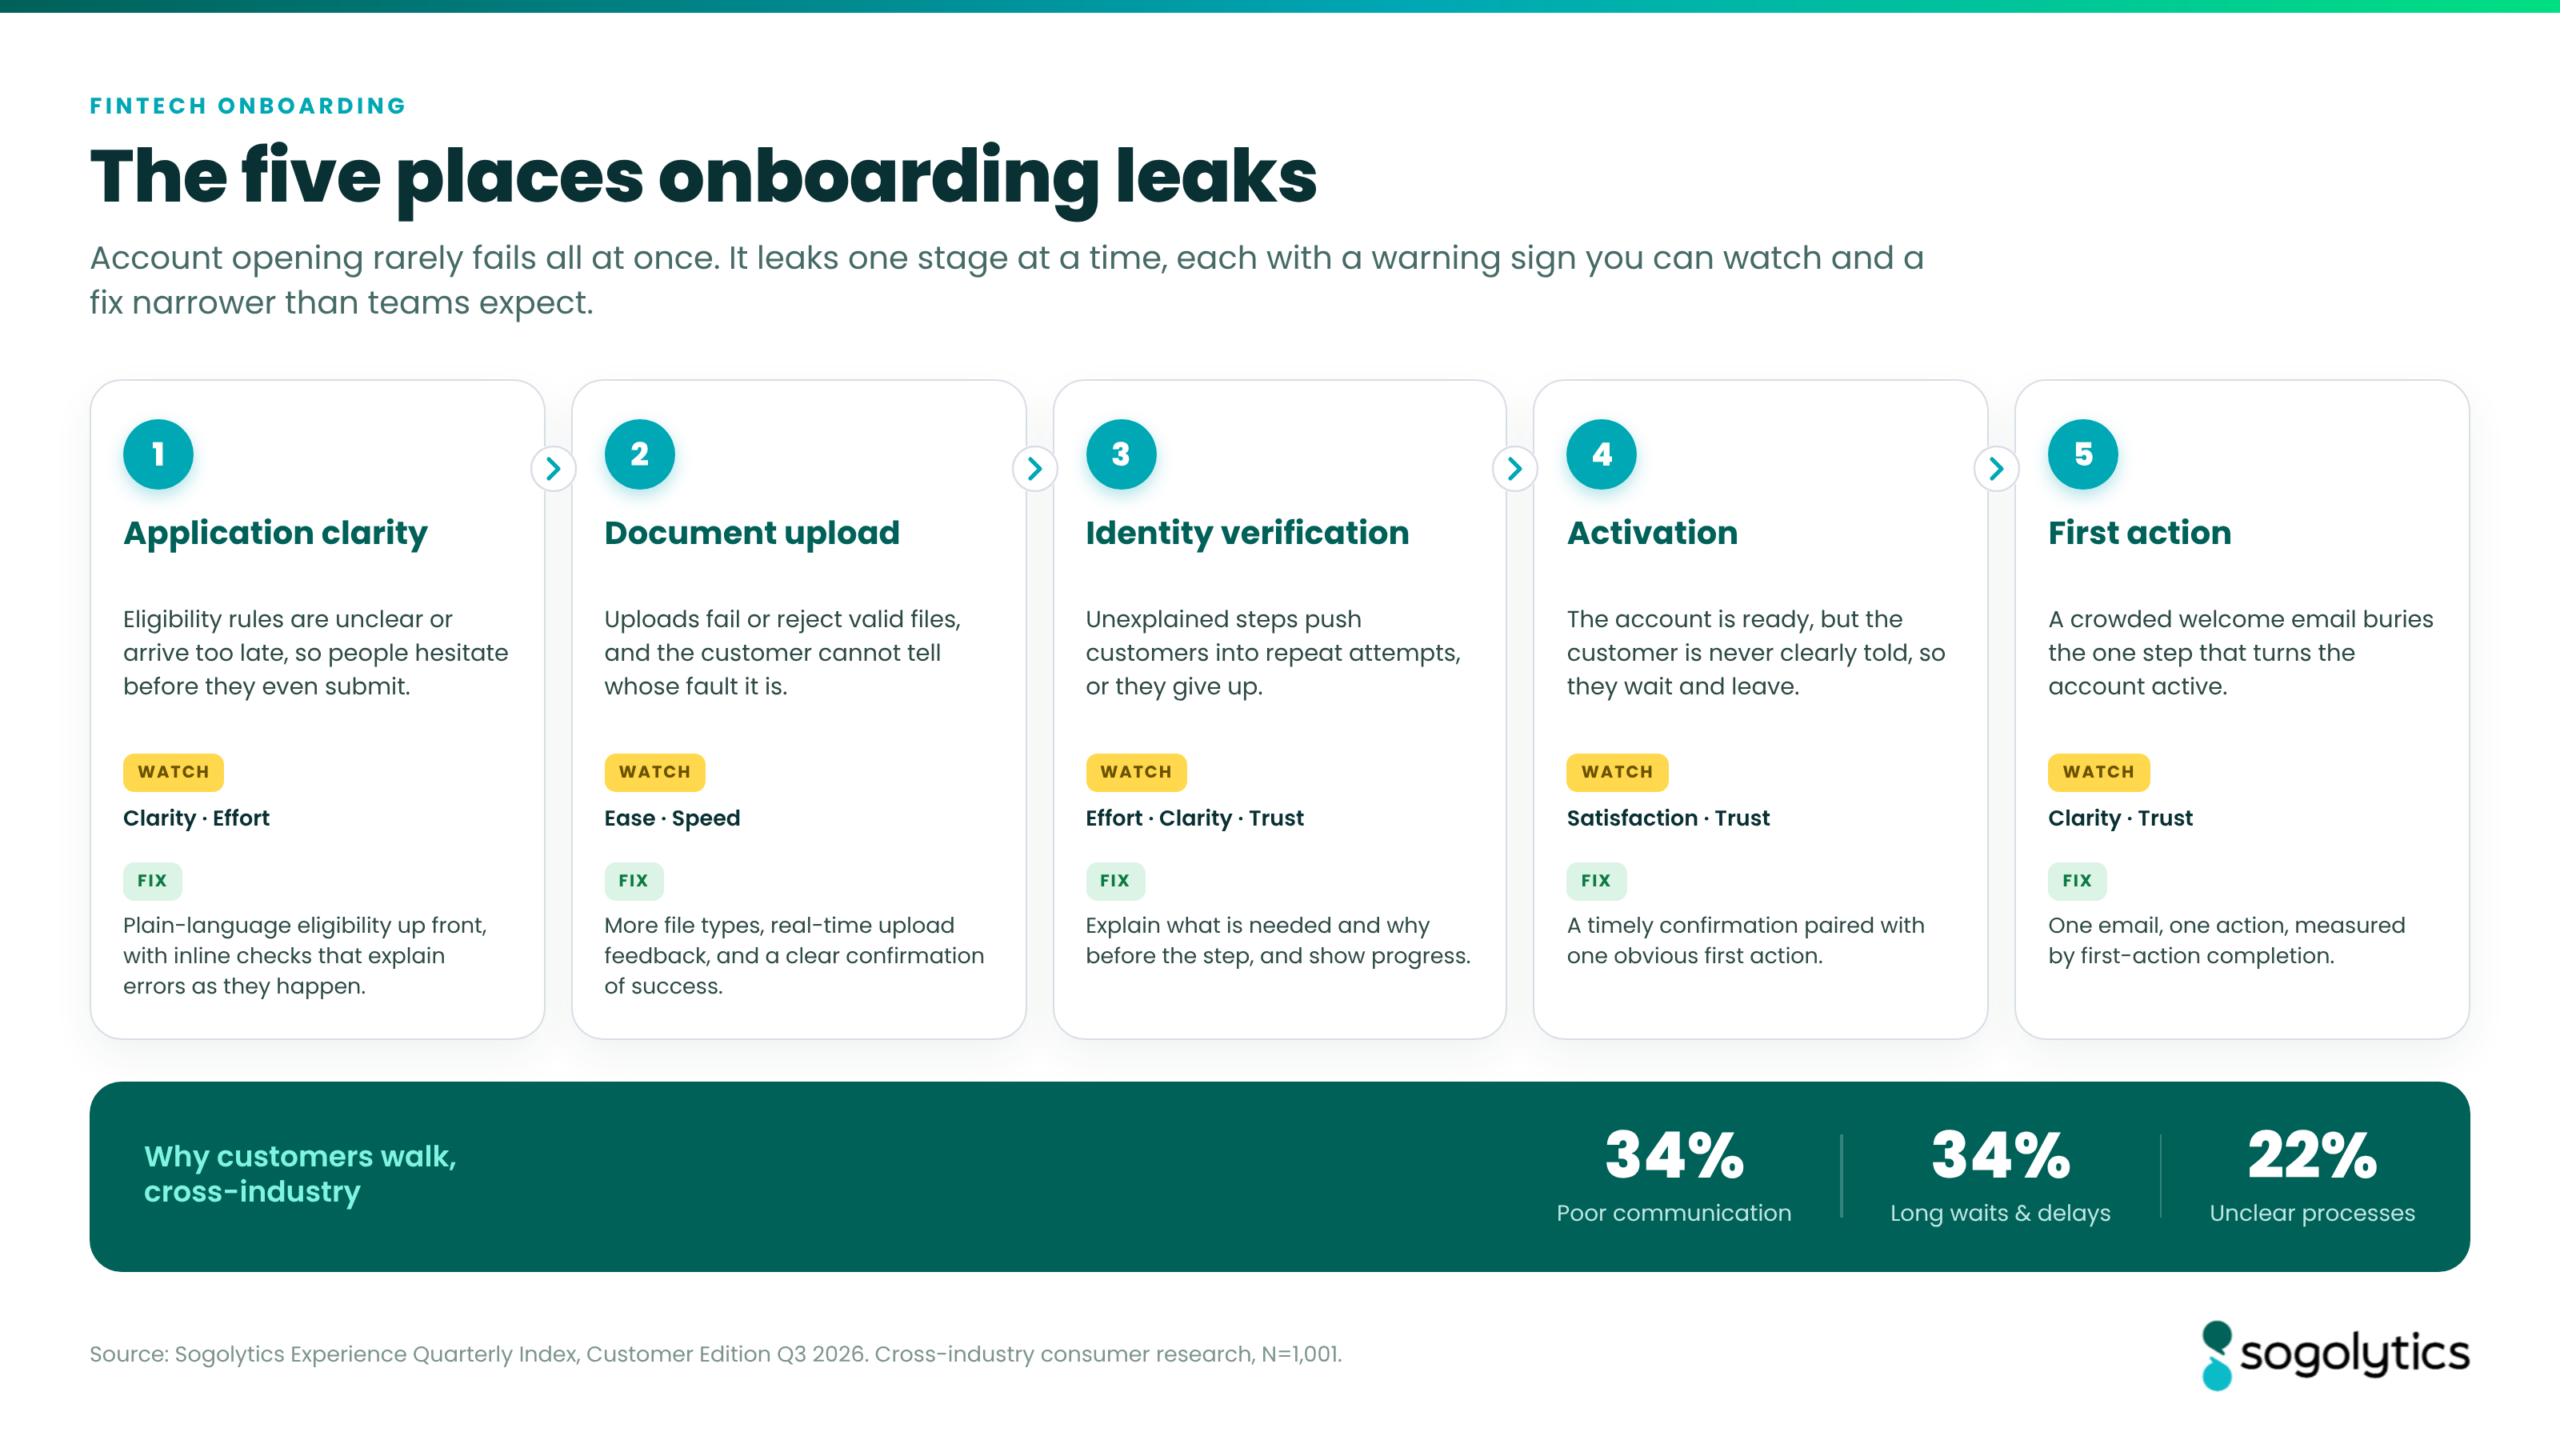
Across the account-opening journey, five weak spots cause most of the lost sign-ups. Each has a warning sign, a number to watch, and a fix that rarely needs the big rebuild teams assume.
1. Application clarity
People hesitate or quit before they even submit, because the rules for who qualifies are unclear or show up too late. The warning sign is a low clarity or effort score on the application step. The fix is plain-language guidance about who qualifies, shown up front before the customer spends time, plus inline checks that explain errors the moment they happen.
2. Document upload
Uploads fail, reject valid files, or time out, and the customer cannot tell whether the problem is theirs or yours. Watch ease of use and speed. The fix is to accept more file types, show real-time feedback as the file uploads, and confirm clearly when it goes through.
3. Identity verification
Verification is required by law, but how much effort it costs the customer is a choice you make. When the steps are not explained, people try again and again, or give up. Watch effort, clarity, and trust. The fix is to say what you need and why before the step starts, and to show progress so the customer knows things are moving.
4. Activation
The account exists, but the customer is never clearly told it is ready to use. Silence reads as failure, so they wait and then leave. Watch satisfaction and trust. The fix is a clear, well-timed confirmation paired with one obvious first thing to do.
5. First meaningful action
The welcome email is crowded and buries the one step that turns a new account into an active one. Watch clarity and trust. The fix is one email with one clear action, measured by how many people take that action rather than how many open the email.
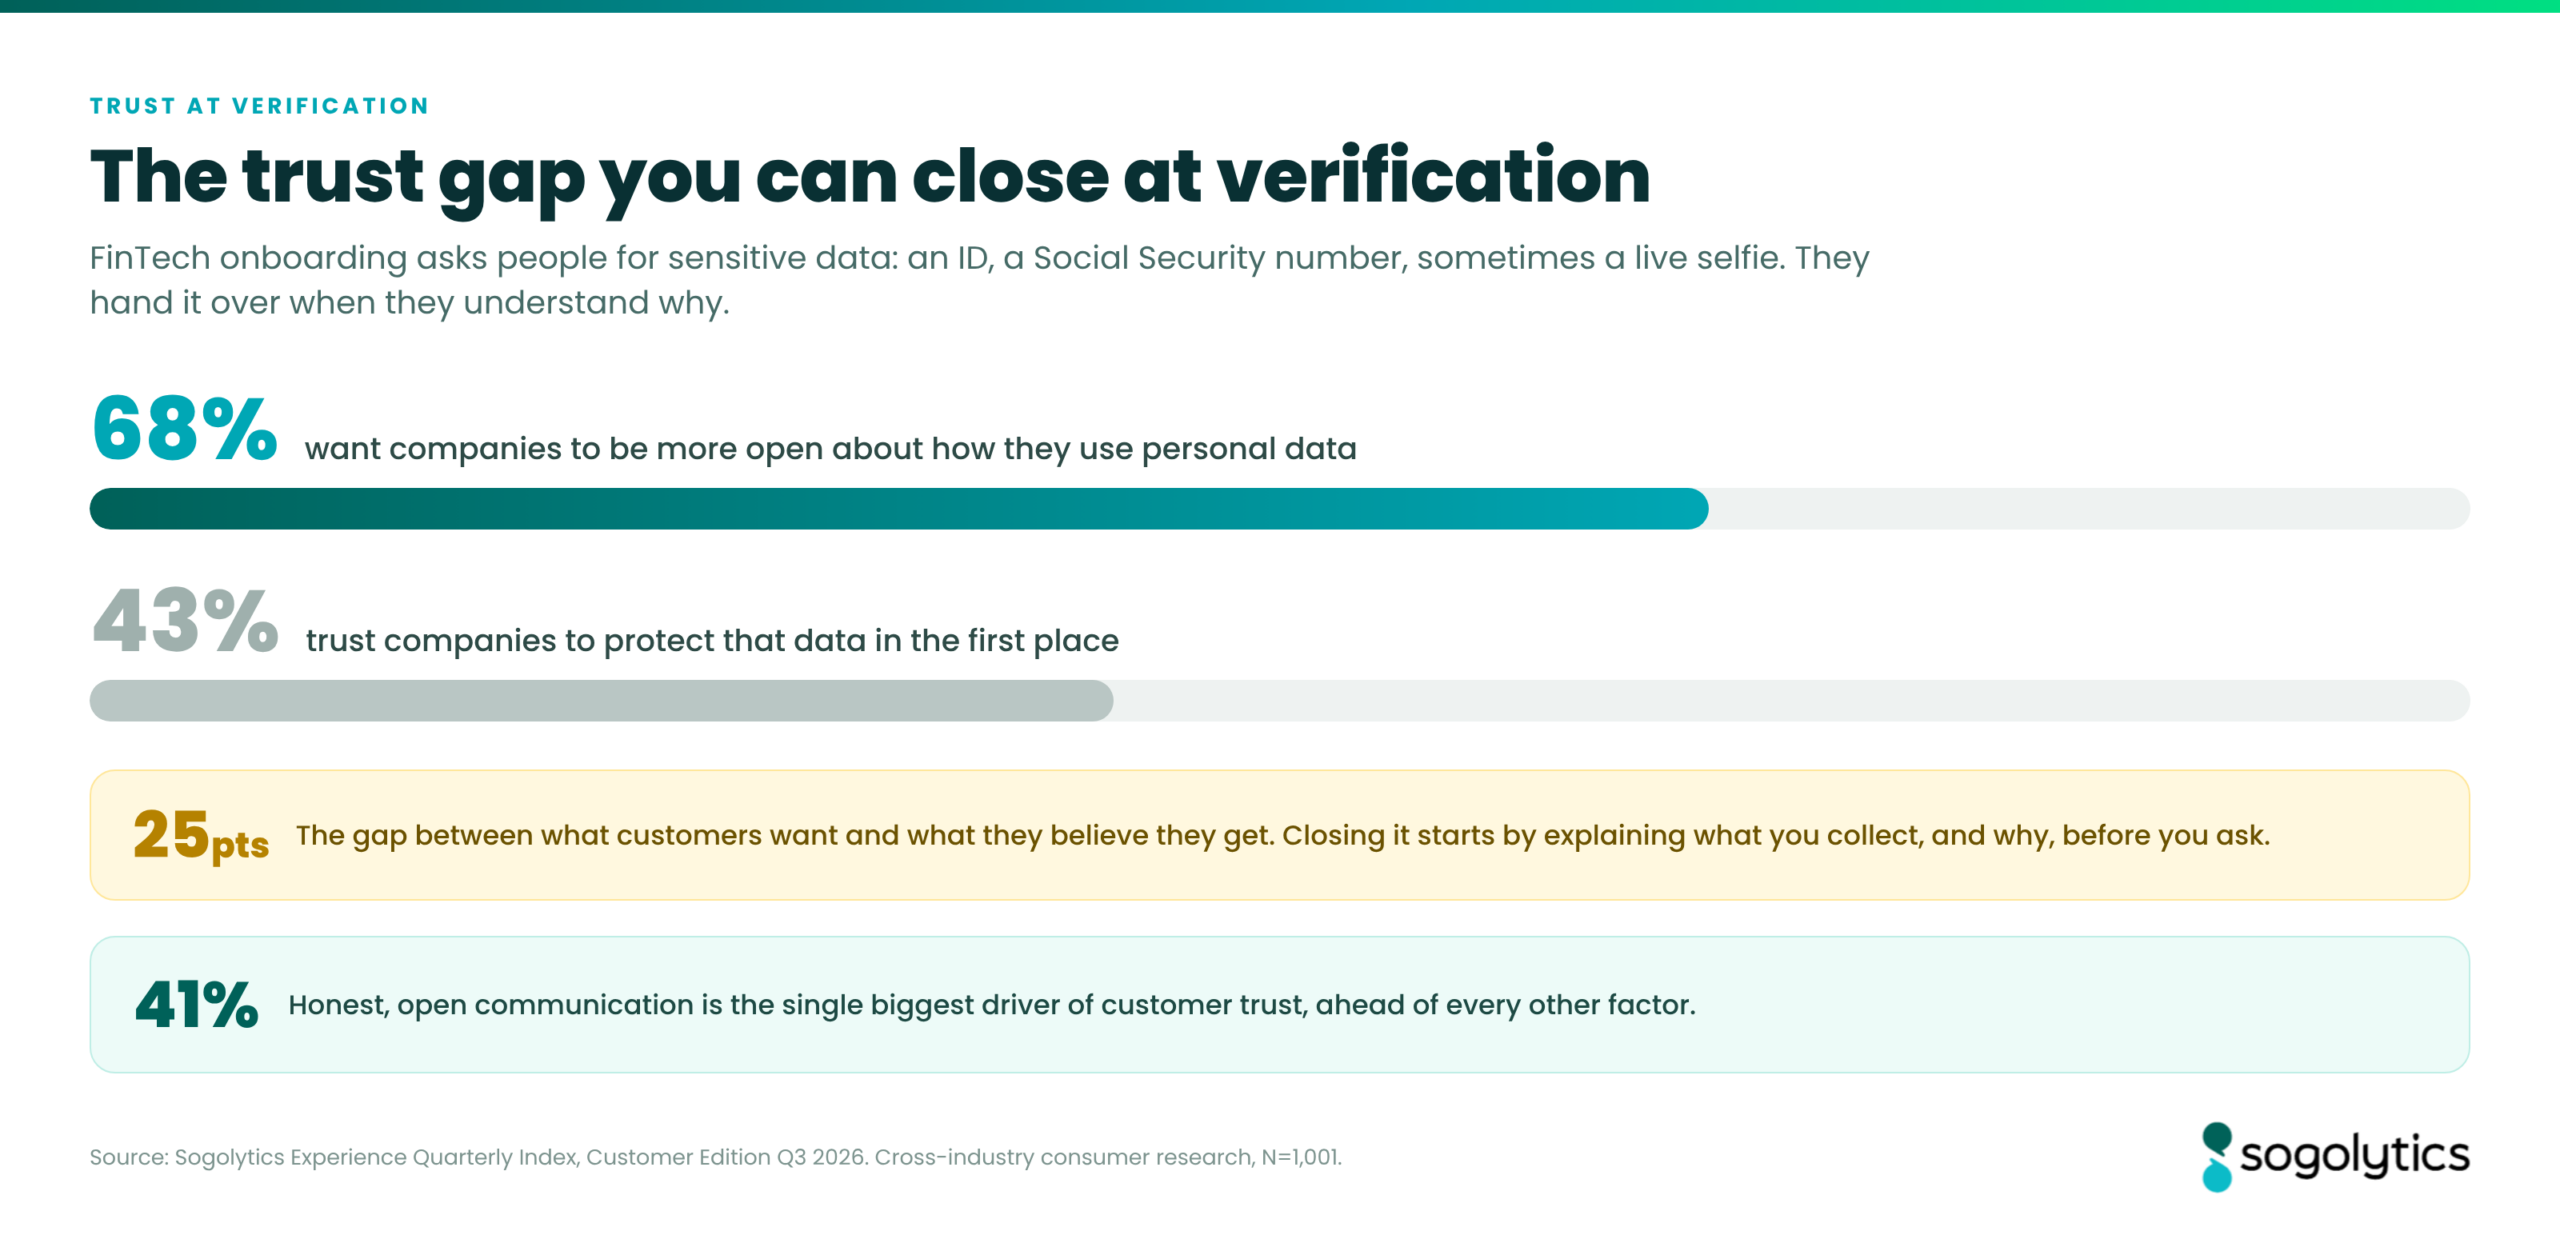
The verification step deserves a closer look, because it is the step where trust is easiest to lose. Fintech onboarding asks people to hand over sensitive details: a government ID, a Social Security number, sometimes a live selfie. They will do it, but only if they understand why. The same Q3 survey found a wide gap on trust. 68 percent of consumers said they want companies to be more open about how they use personal data, but only 43 percent trust companies to protect it. That is a 25-point gap. Honest, open communication was also the top driver of trust, named by 41 percent. So tell people what you are collecting and why, before you ask for it, and the hardest step in onboarding gets easier.
Catch the Friction While It’s Still Fresh
The habit that sets strong onboarding teams apart is when they ask for feedback. A survey sent once a quarter cannot tell you why account opening leaked in week three. A short, one-question effort survey, fired at the exact step right after a document upload or a verification attempt, can. A quarterly survey tells you how people feel in general, while a one-question survey at the step that just failed tells you exactly what to fix.
Teams often worry that asking for feedback mid-flow adds friction to a process that is already fragile. In practice, a single well-timed question on one screen, with an optional comment box, gives you better signal than a long survey sent days later. It does not lower completion much. The person who just wrestled with an upload is the most motivated source you will ever have. They want you to know what went wrong.
How fast you act matters as much as what you collect. Feedback that sits in a dashboard for a quarter does nothing for the customer who flagged the problem, or for the next thousand who hit it. The Q3 Index shows the cost of that delay. Among people who shared feedback, the share who said it led to a clear improvement fell from 42 percent to 30 percent in one quarter. Over the same period, the share who saw no change at all nearly doubled, from 17 percent to 29 percent. That gap carries a loyalty cost. 53 percent of people who saw their feedback lead to real change called themselves very loyal, compared with only 30 percent of those who saw nothing change.
So strong teams keep the loop short. They route in-the-moment signals straight to the squad that owns the step, with a threshold that triggers a review when effort spikes. Spot the friction, confirm the cause, ship the fix, and watch that step’s effort score recover. That rhythm, more than any heavier survey, is what turns feedback into completed accounts.
The Gaps Emerge Between Touchpoints
Onboarding resists quick, single-screen fixes because the failures build up across teams. The application form, the verification flow, and the welcome emails are often built by three different teams. Nobody owns the joints between them. A customer who has already spent patience on a confusing eligibility check reaches document upload with less to give. A small delay they would have shrugged off becomes the reason they quit.
This is why mapping the whole journey matters more than polishing any single step. Effort adds up as the customer moves along. It has to be managed as a journey, with one owner responsible for the seams and a shared view of where effort collects.
For the application and activation stages, Sogolytics’ New Account Experience survey is a ready starting point. A framework like Experience Navigator gives the whole map a starting shape. It lays out the onboarding touchpoints for financial services, names the likely pain point at each one, and points to the metric and the short survey that measures it. That way the team spends its time fixing rather than hunting.
Fix the Costliest Leaks First
Picture a digital lender whose loan-application completions had flattened, even though the app itself reviewed well. The team assumed the form was too long. Mapping the journey and attaching short effort surveys to each step told a different story. The length of the form was fine. The real leaks were elsewhere: an upload step that rejected photos taken with a phone camera, and a verification stage that gave no sense of how long it would take.
Two narrow fixes brought back a meaningful share of the abandoned applications within a quarter: broader file support, and a progress bar with an expected wait time. Because completed onboarding fed straight into deposit growth, those recovered applications kept paying off well after launch. Neither fix touched the form the team had been ready to rebuild. The example is made up, but the sequence is real: map the journey, measure each step, isolate the leak, fix it. That is how a soft completion number becomes a specific, fixable list.
Conclusion
Onboarding is the most measurable part of the customer relationship. For many fintech teams, it is still the least understood. To make real progress, treat account opening as a funnel with named weak spots. Measure each one at the moment it happens. Give the whole journey a single owner, rather than handing each screen to a different team and hoping the joints hold.
None of this needs new technology or a bigger headcount. The Q3 data makes that point plainly. The things that drive people away, poor communication, long waits, and unclear steps, are process failures that no new platform will fix. Explain the price and terms before checkout, while the customer can still act on them. Tell people what a step needs and why, and confirm clearly when something has worked. The leaks are predictable, so measure them early, fix them fast, and you keep the customers you have already paid to acquire.
Break onboarding into its component stages, application, document upload, verification, activation, and first action, then instrument each one with a short in-moment survey. This converts a vague completion problem into specific, diagnosable steps. Most teams discover that a small number of breakpoints, often document upload and unexplained verification, account for the majority of abandonment, which makes the fixes narrow and affordable rather than a wholesale rebuild.
Combine funnel analytics with in-moment feedback. Analytics show where customers stop, but not why. A one-question effort survey fired immediately after a friction-prone step, such as an upload or a verification attempt, captures the reason while it is fresh. Pairing the two lets a journey team isolate the specific cause of a drop rather than guessing, which is what makes the resulting fix reliable.
Customer effort is the anchor metric, because onboarding is fundamentally about how hard the process feels. Alongside it, track clarity at the application and verification steps, speed and ease at document upload, and trust and satisfaction at activation. Completion and first-action rates connect these experience signals to the business outcome. The combination shows both where the friction sits and what it is costing.
Not when they are designed well. A single effort question on one screen, with an optional open comment, adds negligible friction and does not meaningfully depress completion. The signal quality is far higher than a long survey sent days later, because the customer is responding while the experience is fresh. The mistake to avoid is stacking multiple questions into the flow, which does add friction.
Because onboarding effort is cumulative. A customer who arrives at a step already frustrated by earlier friction has less tolerance for even a minor delay. Fixing the single worst screen helps, but if the earlier steps still drain patience, the abandonment simply moves. Sustained gains come from managing the whole journey and the seams between screens, not from optimizing one interaction in isolation.
Experience Navigator maps the onboarding journey across digital, physical, process, and human touchpoints, names the likely pain point at each, and recommends the specific feedback project that measures it. Instead of starting from a blank page, a journey team begins with a diagnostic scaffold that already ties each step to a metric and a survey. That shortens the distance between suspecting a leak and confirming exactly where it is.