
Most organizations collect feedback on a set schedule, whether for an annual review, a board requirement, or a regulatory obligation. Think quarterly employee engagement surveys or routine feedback requests after a support call. The responses come in; a report gets saved, and too often, that is where the process ends. The team moves on to the next task while the data sits untouched. By the time someone reviews the findings or takes action, the moment that prompted the feedback has already passed.
The delay usually comes from the work that happens after collection: getting results to the right people, shaping them into something clear, and acting before the window closes. The latest updates to Sogolytics, the experience intelligence platform teams use to collect and act on customer and employee feedback, are built to speed up that part of the work. Here’s what’s changed since our last update.
Share Your Tracking Without Handing Over Your Account
Track is where you monitor a survey once it’s LIVE. The dashboard shows who received your invitation, who opened it, and who has responded so far. Until recently, keeping other people in the loop meant downloading reports, taking screenshots, or sending manual updates every few days.
That is where the Shareable Track feature in our enterprise dashboard comes in. It lets you create a secure link to the Track page of a running survey, or to a single part of it like a graph or a table and send it to anyone. By default, the link is View Only, and recipients do not need a Sogolytics login to open it.
You stay in charge of what each recipient can do:
- Choose which Track tabs and details they can see
- Decide whether they can filter results, export data, or open up individual responses
- Add a password and set a date for the link to expire
- Feel free to send the link immediately, schedule it for later, or set it to go out on a repeating basis
- Review and manage every link you have shared from one place
How it helps?
Say you’re running a company-wide employee engagement survey. Department heads want to know how many of their people have responded, but you’d rather not open the full project to them. Send each leader a link that shows participation numbers and nothing else. Or picture an agency running a study for a client: set up a recurring link, and the client always sees the latest numbers without a weekly email from you.
More Control Over How Your Dashboards Look
Custom Dashboards let you pull your most important charts and numbers into one view. These updates make that view clearer and easier to work with.
The first is conditional formatting for graphs. You set rules that change how a graph looks based on its values, so a score that drops below target shows in a different color and the problem area stands out the moment the dashboard opens. The rules work on segmented and non-segmented graphs, Score widgets, and Tag and Trend widgets, and you can set individual bars to specific colors to draw the eye to a particular answer.
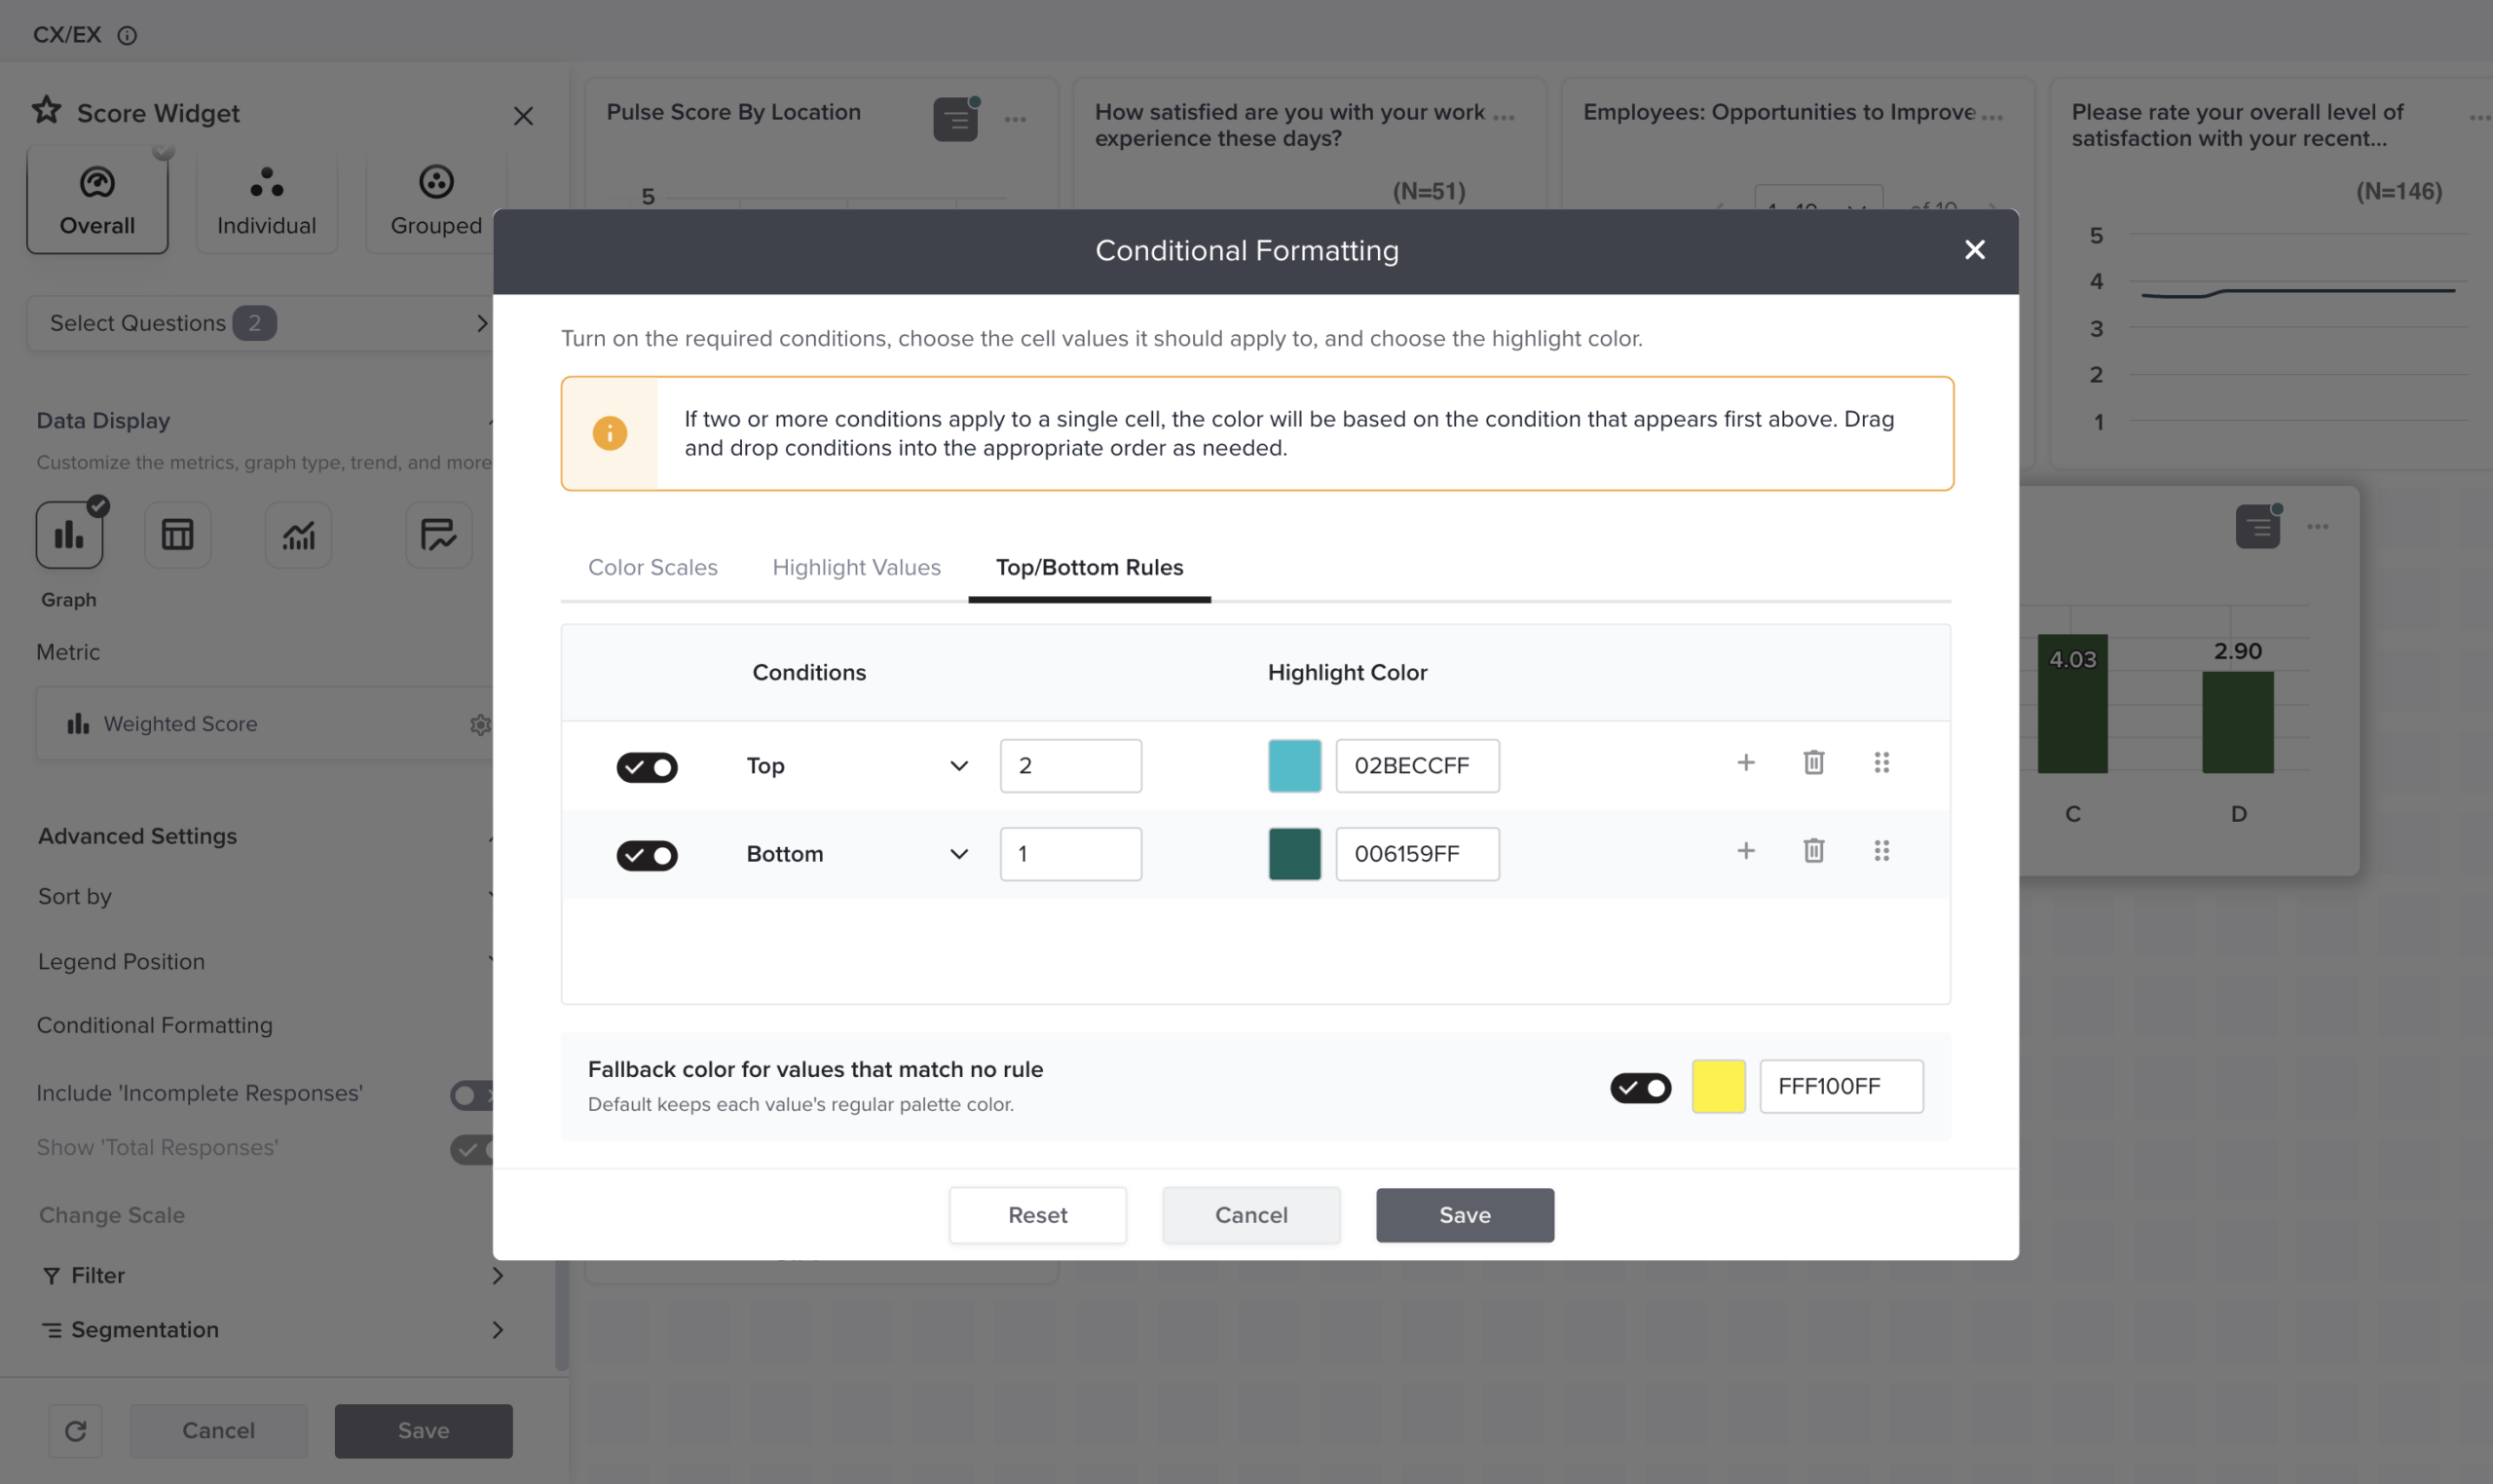
A few smaller changes add up. You can now sort data across more widgets, including Table, Cross Tab, Raw Response, NLP, and Score widgets, so information sits in whatever order suits the analysis. In Table widgets, drag a column border to make room for a long question or answer. As your list of dashboards grows, labels let you group and find them fast, by region, quarter, or team.
There’s more room for the people you share with, too. Administrators can let recipients download individual widgets and choose which file formats are available. Recipients work with the data on their own terms, and administrators still decide how far that access goes.
How it helps?
Imagine a retail brand tracking customer satisfaction across twenty stores. With conditional formatting, every store scoring below 80 shows in amber, so the regional manager spots the three that need attention without reading a single number. Labels keep each region’s dashboard easy to find, and store managers download just the chart that applies to them.
Automate How Your Data Comes in
Most teams gather feedback through more than one channel. Some runs through Sogolytics; the rest sits in other tools, storage systems, or separate projects. Pulling it together by hand takes time and invites errors.
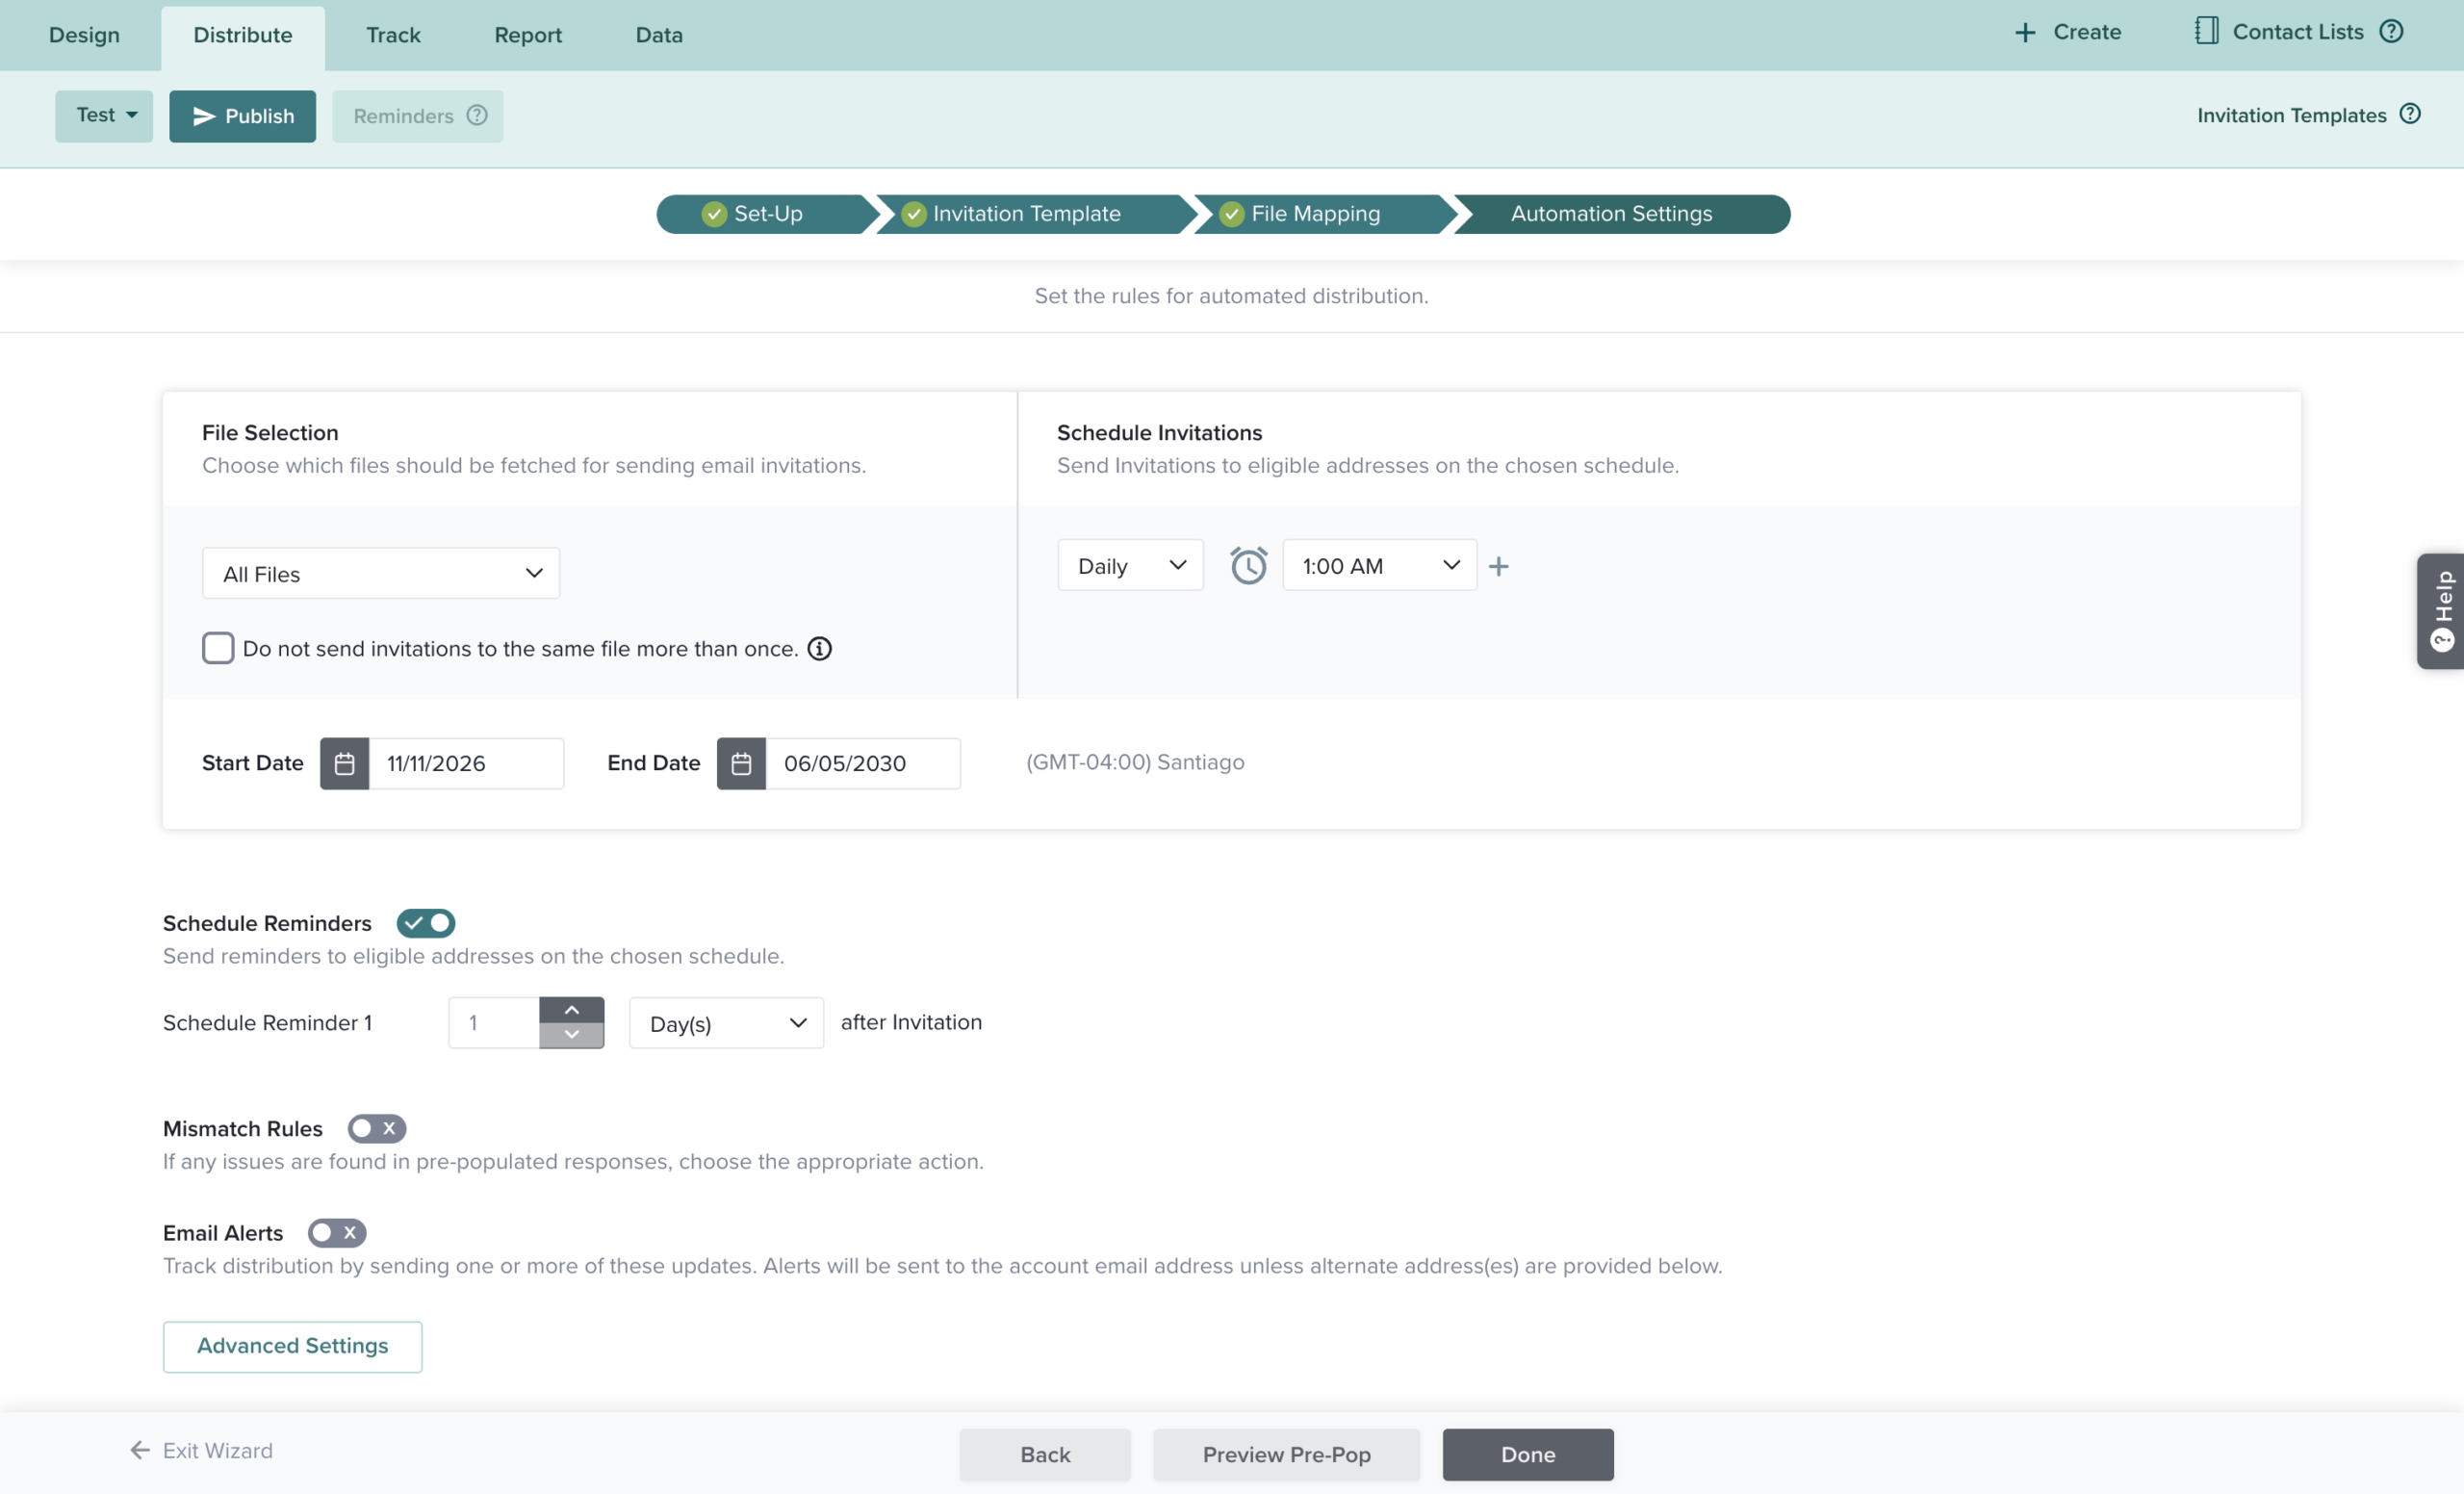
Import Automation now does more of that work for you. You can set up automatic imports from SFTP, Google Drive, and OneDrive, and bring in responses from your other Sogolytics projects. Once it’s configured, the data updates on a set schedule, with no manual uploads.
How it helps?
Think of a research team juggling several projects at once. Instead of exporting and re-importing responses every week, they connect the projects and let the data flow into one place for analysis. Or a brand that receives survey data through a shared drive can schedule imports to run automatically, so the data is ready the moment the team opens its report.
Permissions That Scale with Your Team
As a team grows, managing access across people, projects, and folders gets more complex. Setting permissions one project at a time quickly becomes hard to maintain.
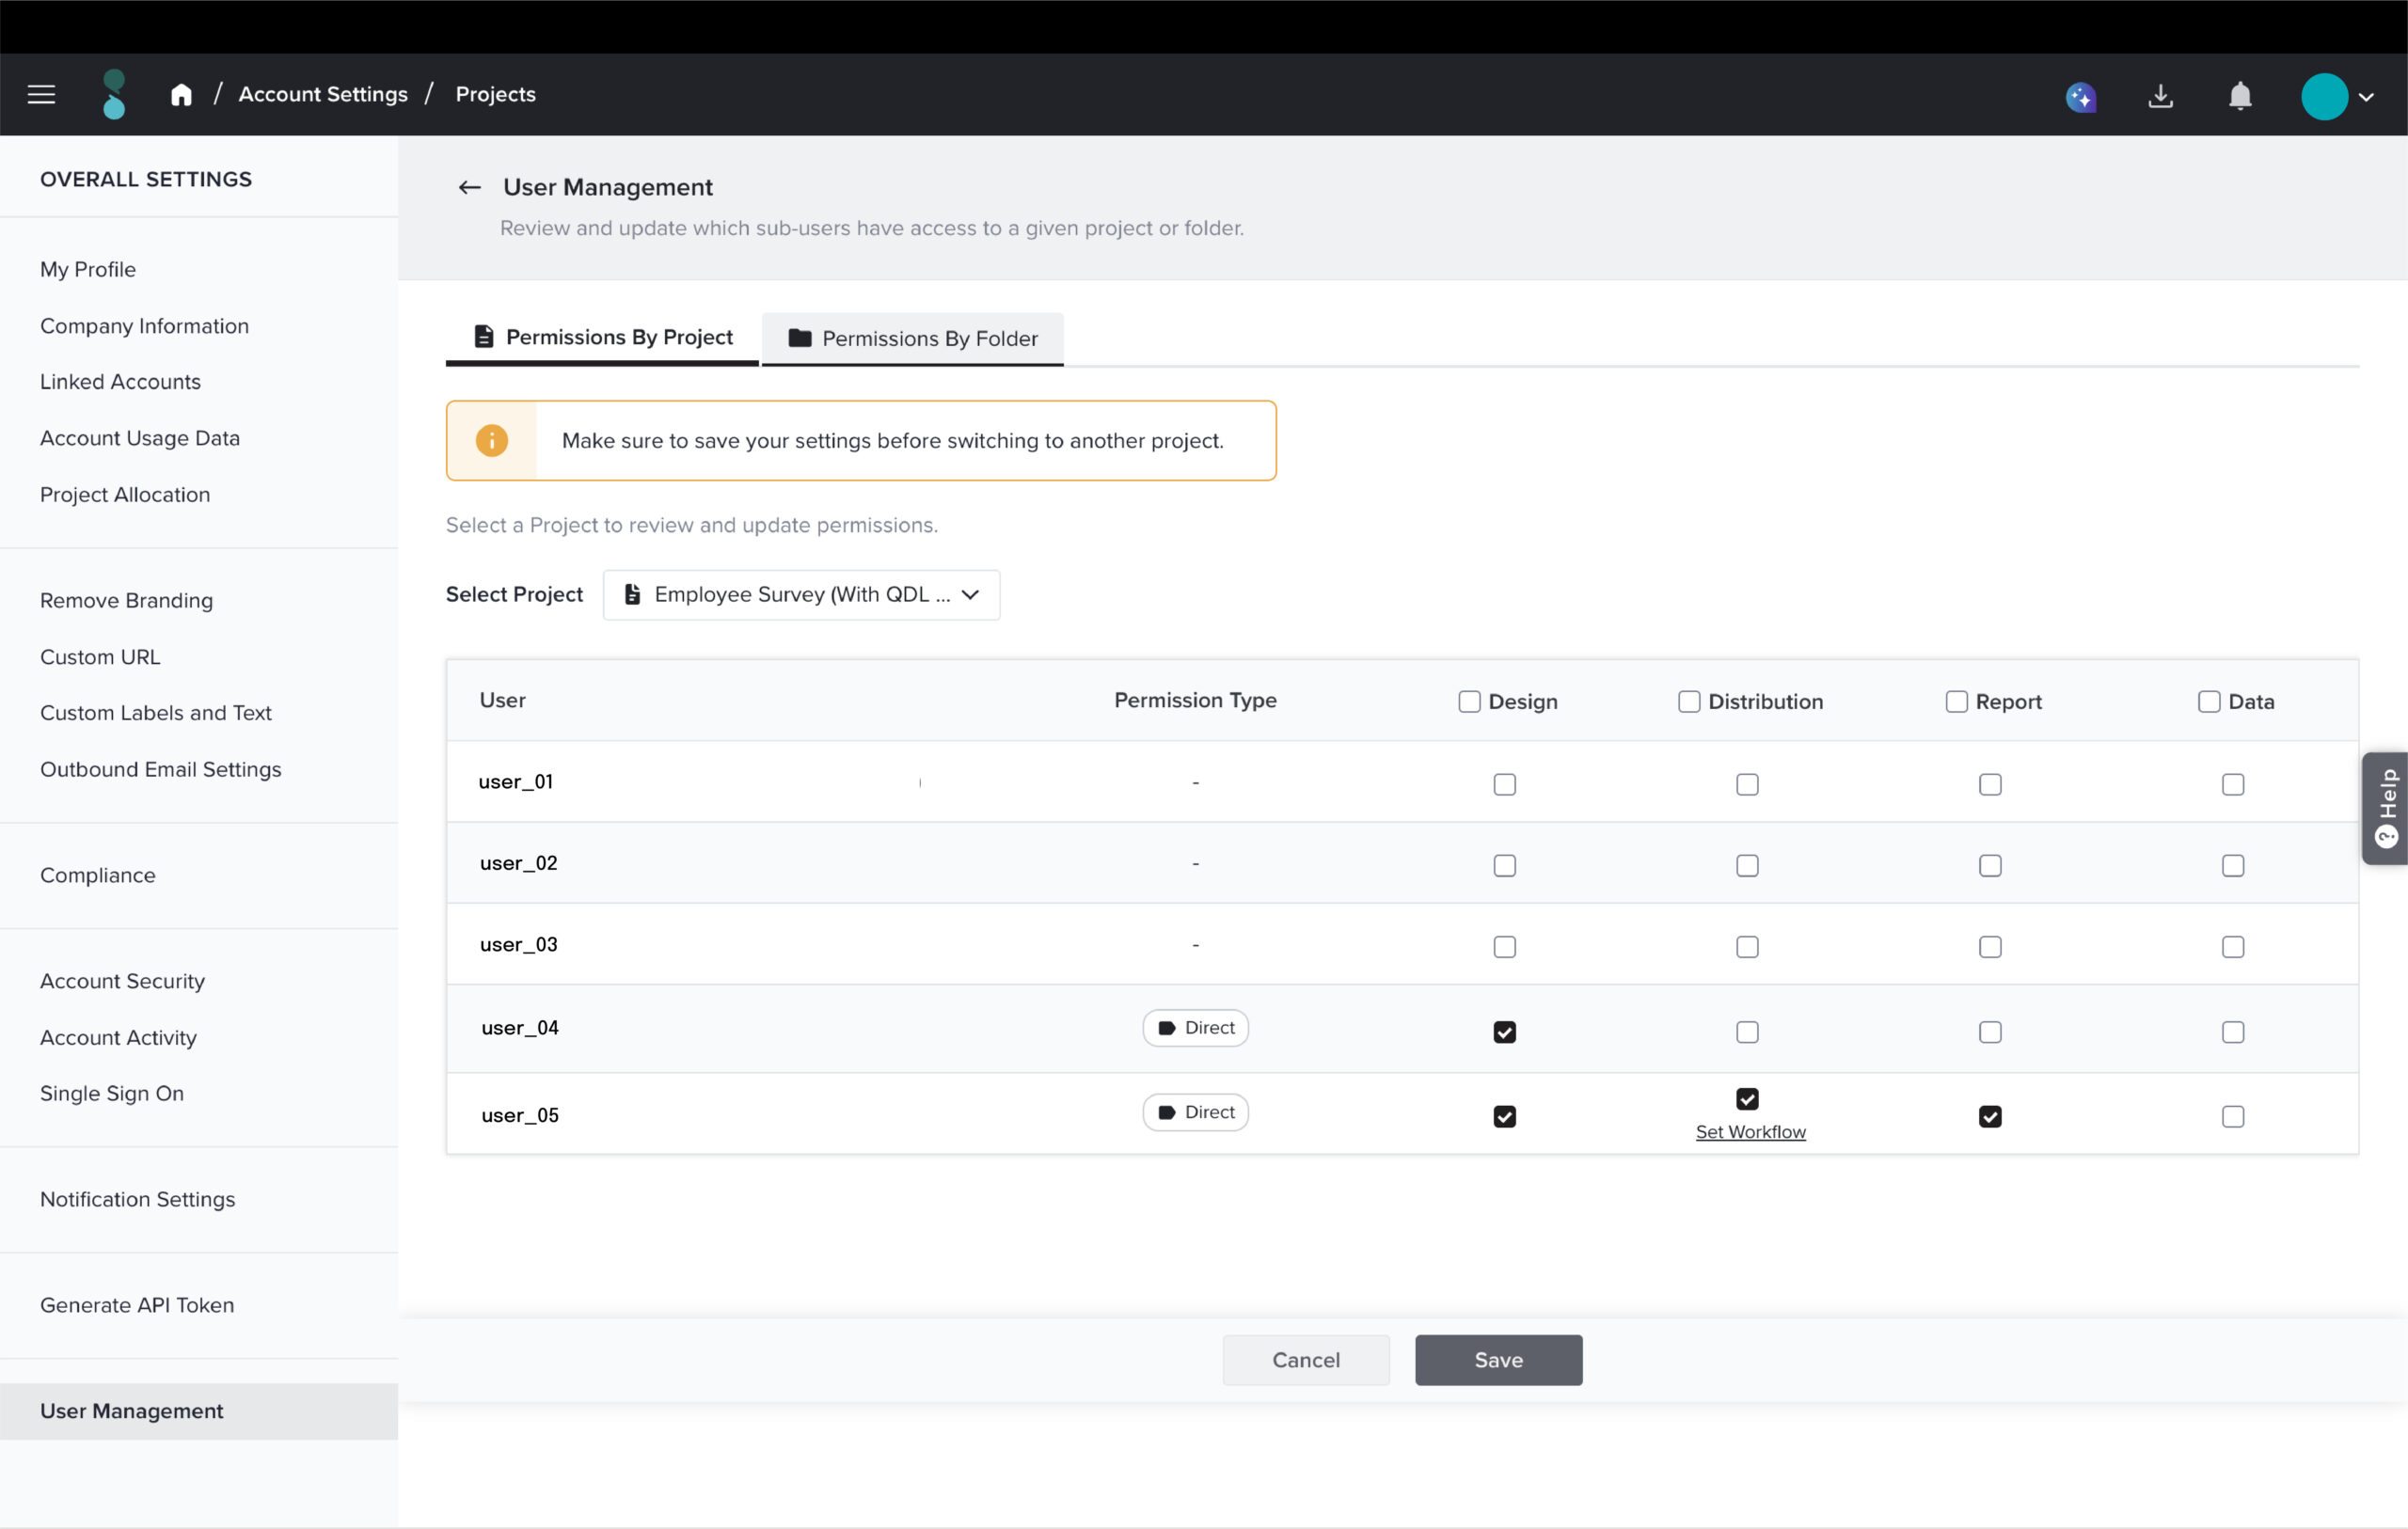
Folder-level Permissions make this easier for any team with more than one user. Administrators set access at the folder level instead of project by project, and those settings apply to the projects already in the folder and to any project added later. When a single project needs something different, you can still give it its own permissions. The updated view also makes it clearer how access was granted, and where a folder and a project don’t match.
How it helps
For a department running dozens of surveys, a new team member can be given access to an entire folder in one step, instead of being added to each project by hand.
More Enhancements Across the Platform
Alongside the bigger features, these updates smooth out everyday tasks. A few worth calling out:
- Directories no longer require an email address or phone number. Organize records by any unique identifier and add contact details later, which helps while you’re still gathering information.
- SMS tracking now shows detailed delivery statuses and the reason a message failed, so you’re not guessing why an invitation didn’t arrive.
- Usage alerts email you when your account hits 80% and 100% of its email or SMS limit, so a campaign doesn’t stall by surprise.
- Personalized SMS messages can include mail merge details, so a text can greet each person by name or reference their own information.
- EX Text Analysis reports now include a Metadata tab, already familiar to CX users, which helps teams dig into open-ended employee feedback.
- Accessibility-compliant color palettes now apply across all chart types, so reports are easier for everyone to read.
What These Updates Mean for Your Brand
Taken together, these changes share one goal: fewer manual steps between collecting feedback and acting on it.
- You keep stakeholders informed with less effort: secure, self-updating links replace the weekly round of screenshots and status emails.
- Your reports tell a clearer story: conditional formatting, sorting, and labels help the right numbers stand out.
- You spend less time moving data around: automated imports cut manual uploads and the errors that come with them.
- Access stays organized as you grow: Folder-level Permissions give administrators a cleaner way to manage who sees what.
- Your reporting works for more people: accessibility-compliant palettes and clearer tracking support everyone on your team.
Whether you’re sharing progress with a client, building a dashboard for your leadership team, or pulling in data from across your organization, these updates give you back time and keep you in control of your data.