

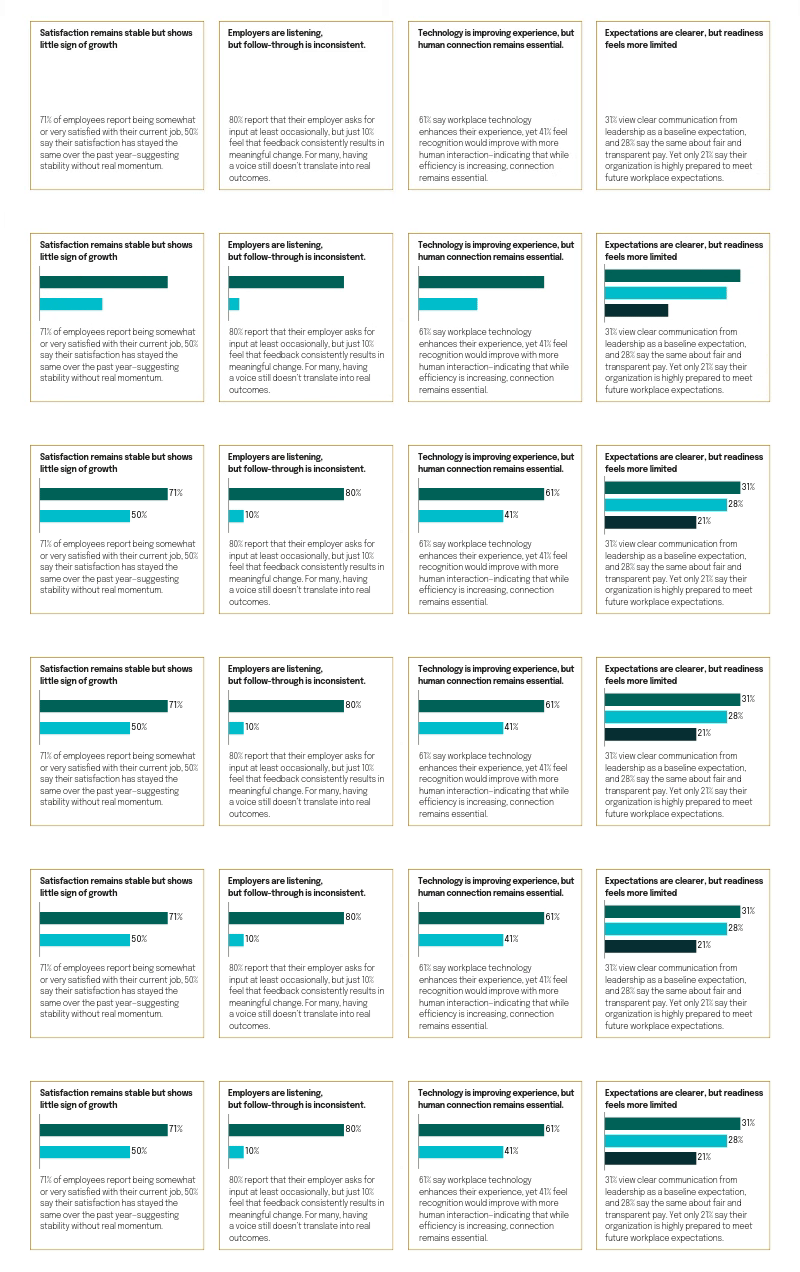
Employee experience in Q1 2026 is marked more by steadiness than by stronger momentum. Satisfaction is holding, but it is not clearly deepening. Listening is present but follow through still feels uneven. Technology is helping with efficiency, but not replacing the need for trust, recognition, and human connection. That pattern runs through the findings in this report. What employees expect from work is becoming more defined, especially around communication, fairness, flexibility, and support. At the same time, employer delivery remains uneven across the areas that matter most. Retention also looks stable at first glance, but the conditions that can drive movement are still active beneath the surface.
About the Study
This report draws on two Sogolytics employee experience surveys of full-time employees in the United States. It combines data from the 2025 annual wave and the Q1 2026 wave to highlight both year-over-year trends and the current state of employee experience. The Q1 2026 results serve as the primary report, with 2025 data included for year-over-year comparisons.
A total of 2,028 employees participated across both waves, including 1,027 respondents in 2025 and 1,001 in Q1 2026. The sample includes a mix of men and women across four age groups, five job levels, and a broad range of industries. These splits support comparison across early career, frontline, management, and executive roles, as well as across sectors such as education, financial services, government, healthcare, hospitality, manufacturing, professional services, retail, and technology.
The survey included single select, multi select, 5-point scale, and open-ended questions covering satisfaction, communication, transparency, technology, AI, workplace expectations, retention, and future priorities.
Results reflect self-reported perceptions and were analyzed to identify current patterns, emerging shifts, and areas where employee expectations and employer delivery do not fully align.
The State of Employee Experience
Employee satisfaction captures how employees evaluate their overall work experience, offering a view into how consistently organizations are meeting expectations.
Overall Job Satisfaction
Employee satisfaction remains largely unchanged compared to 2025. Most employees continue to report being satisfied, but the share of those who are very satisfied has declined slightly, shifting toward more moderate levels of satisfaction. Overall, satisfaction is steady but not deepening.
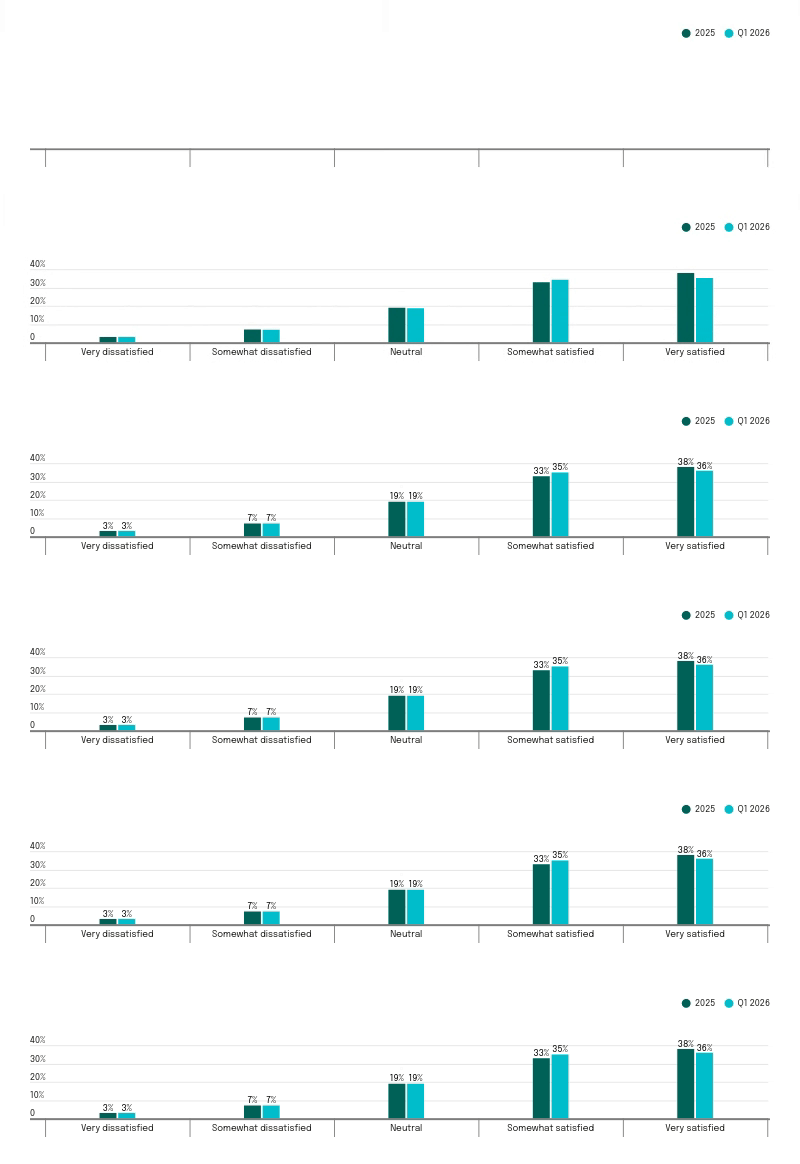
Figure 1: This graph shows how satisfied employees feel in their current jobs. Participants were asked to rate their satisfaction on a 5-point scale. Results are shown for 2025 and Q1 2026. Because of rounding, the total percentage may not equal 100 percent.
A separate question on perceived change supports this trend. Half of employees say their satisfaction has stayed the same over the past year, while 39% say it has increased and 10% say it has decreased.
Satisfaction also varies by age. Younger employees report lower levels of strong satisfaction, with 33% saying they are very satisfied and a higher share remaining neutral. In contrast, mid-career employees show the highest levels of satisfaction, with 38% reporting being very satisfied.
Overall Job Satisfaction by Age Group
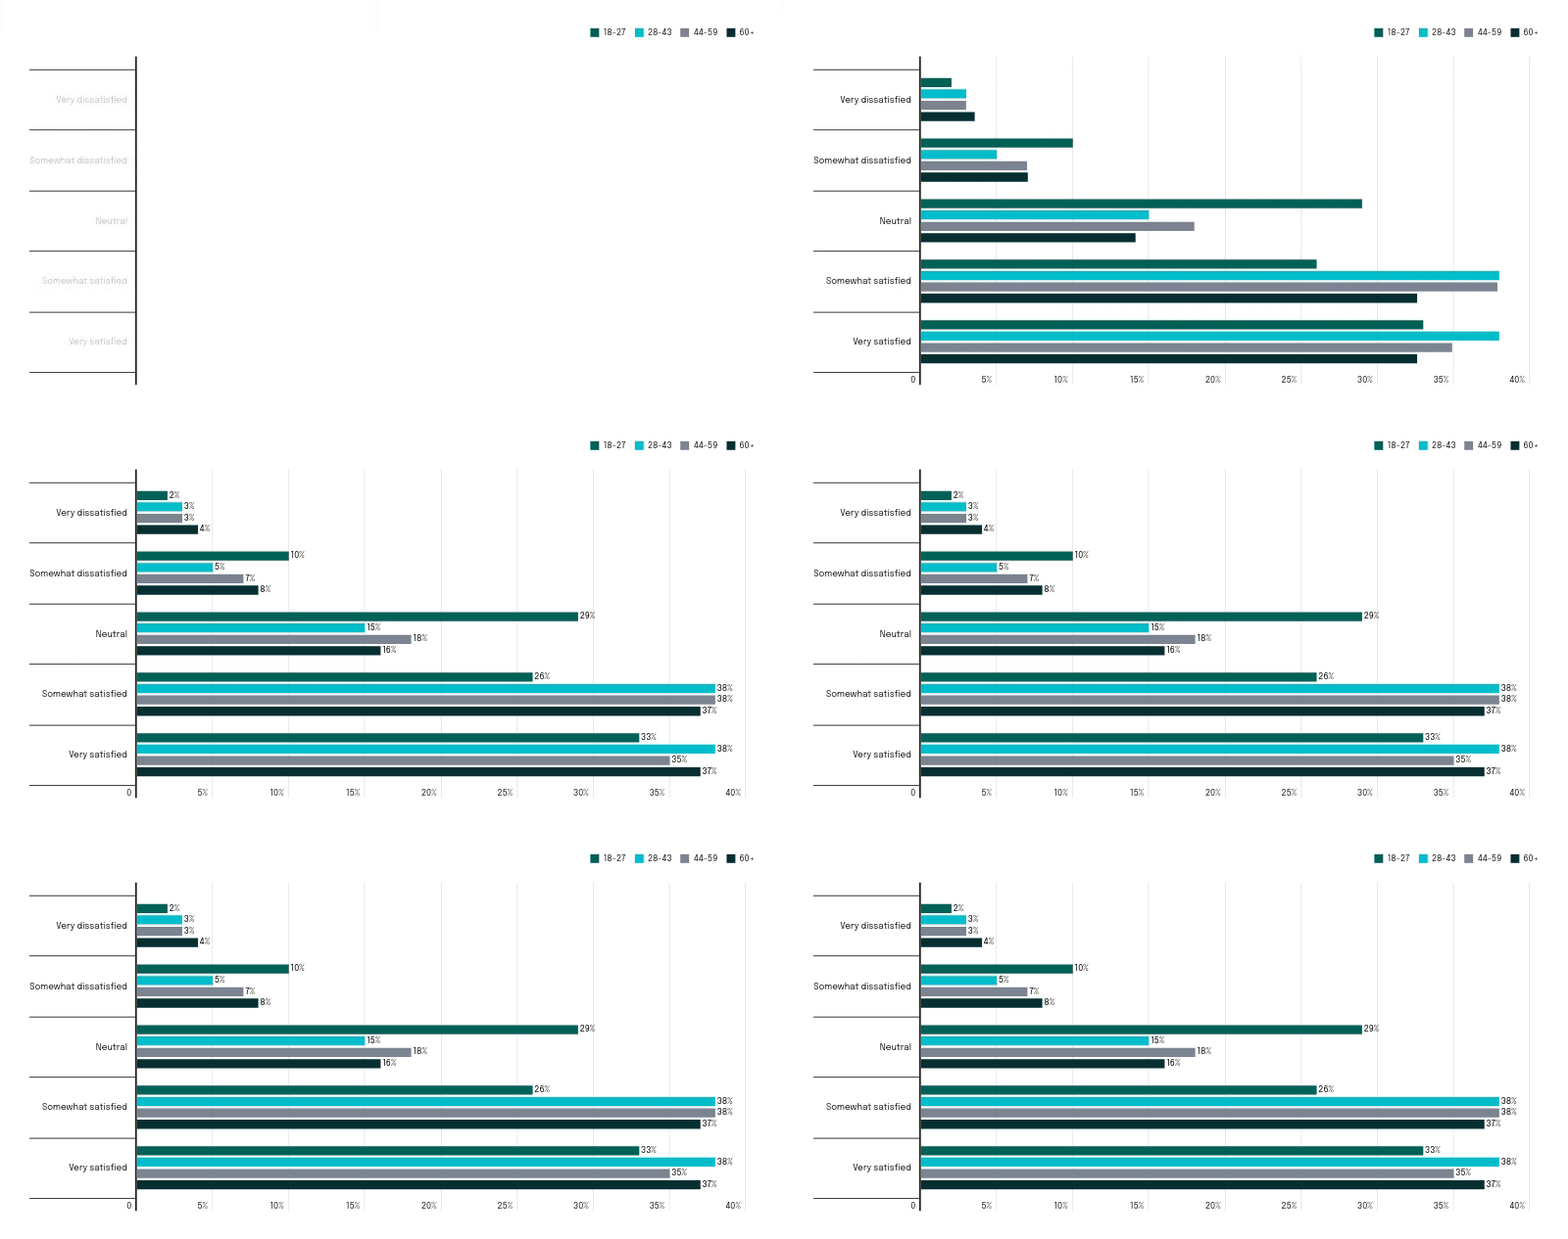
Figure 2: This graph shows how job satisfaction varies by age group. Participants were asked to rate their satisfaction with their current job on a 5-point scale. Because of rounding, the total percentage may not equal 100 percent.
The Satisfaction Gap
Employee satisfaction is influenced by what employees value most and by how effectively those needs are met. The factors that have the greatest impact on satisfaction also highlight where gaps emerge between employee priorities and what employers deliver.
What Drives Satisfaction
Salary (42%) remains the strongest driver of employee satisfaction, followed by work-life balance (37%) and feeling valued and respected (32%). Health and financial benefits also rank highly, while purpose and schedule flexibility remain important but carry less weight than pay and work-life balance. The strongest drivers of satisfaction are practical and personal, centered on pay, workload, and feeling valued at work.
These priorities create the baseline against which employees judge the broader workplace experience. They also provide an important point of comparison for assessing how well employers are delivering on the areas employees care about most.
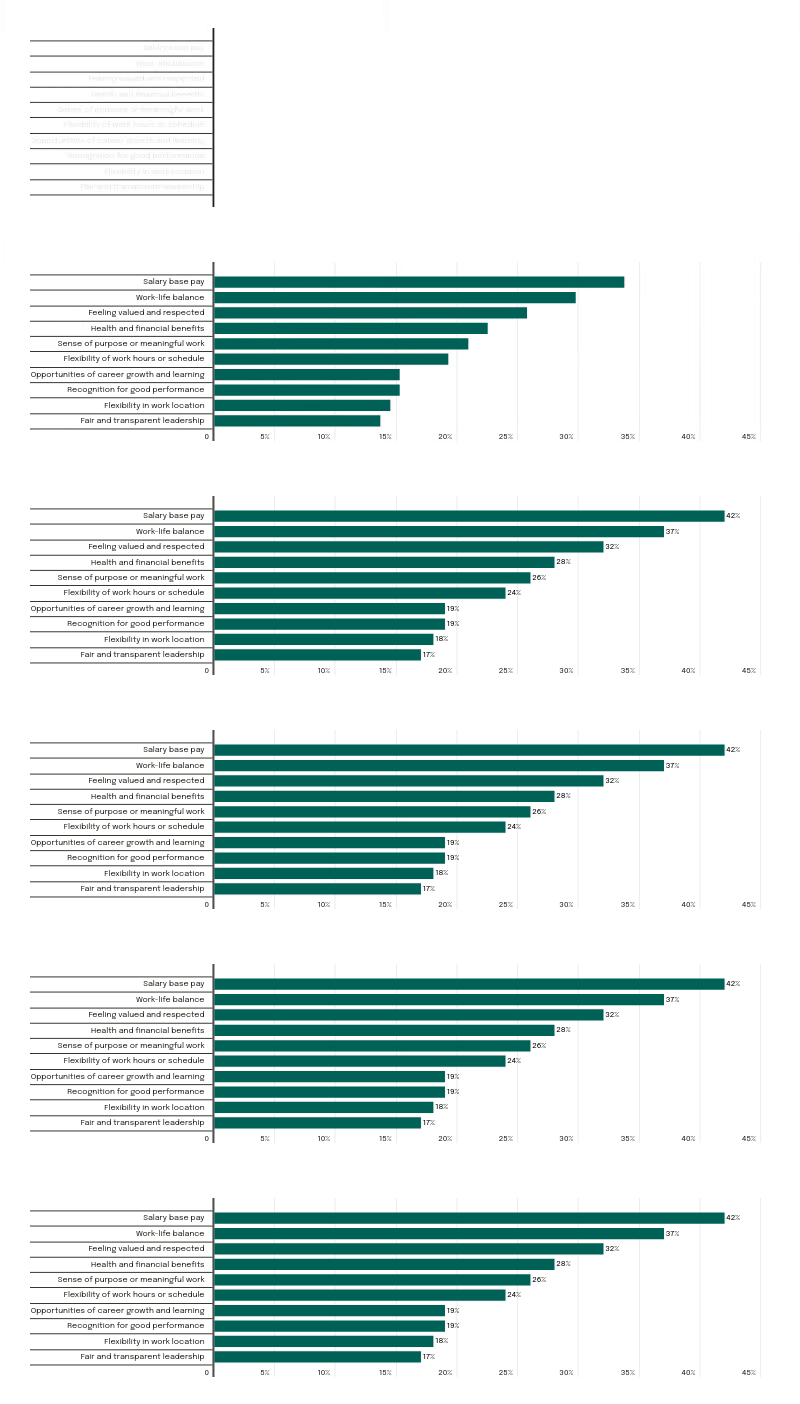
Figure 3: This graph shows the factors that most influence employee satisfaction at work. Participants were asked to select the factors that most influence their satisfaction. Because multiple answers per participant are possible, the total percentage may exceed 100 percent.
Employer Delivery on Key Satisfaction Drivers
Employees generally view employer performance positively across most workplace factors, with the majority rating key satisfaction drivers as somewhat or very good. In Q1 2026, organizations perform best in areas like feeling valued and respected, flexible work hours, and health and financial benefits. However, ratings are comparatively lower for salary, career growth, and work location.
In other words, while employers are doing well overall, there are noticeable gaps in some of the areas employees care about most, suggesting that strong performance isn’t always aligned with top priorities.
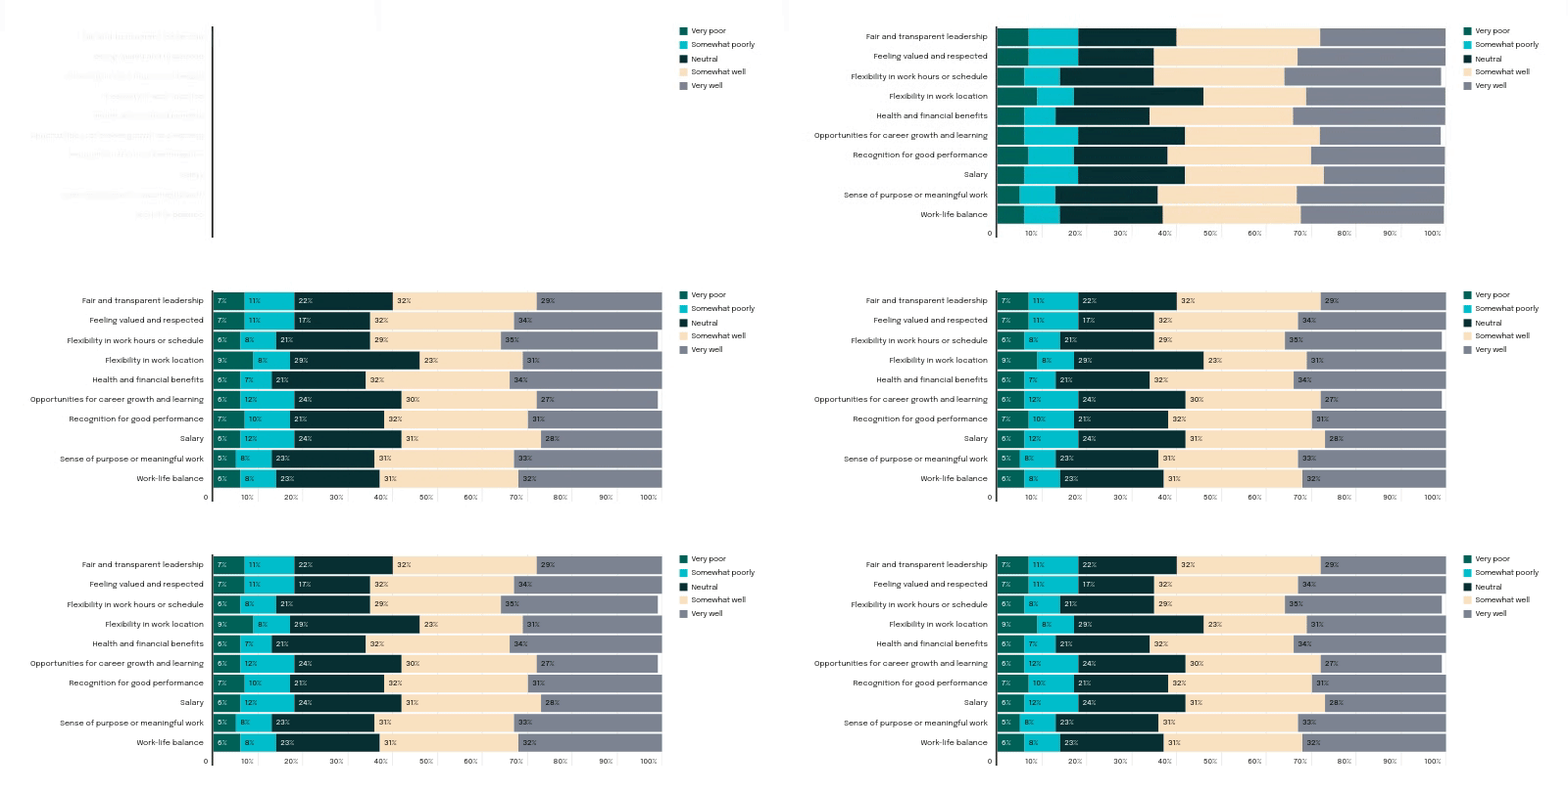
Figure 4: This graph shows how well employers deliver on key factors that influence employee satisfaction. Participants were asked to rate employer performance on a 5-point scale across each factor shown. Because of rounding, the total percentage may not equal 100 percent.
Listening Without Action: The Trust Gap
Gathering employee input is just one aspect of listening. What matters more is whether feedback is collected regularly enough to feel consistent and whether employees see it reflected in communication, decisions, and meaningful change.
Feedback Frequency
In Q1 2026, feedback collection is most commonly described as happening a few times per year (32%) or about once per quarter (29%). Fewer say feedback is collected very often, while a larger percentage says it is sought rarely or never. Most organizations are asking for employee input, but regular listening is still not a consistent part of the employee experience.

Figure 5: This graph shows how often employers seek input from employees through surveys, meetings, or check-ins. Participants were asked to rate the frequency of feedback opportunities on a 5-point scale from never to very often. Results are shown for Q1 2026. Because of rounding, the total percentage may not equal 100 percent.
Compared with 2025, the pattern shows only modest improvement. Quarterly feedback collection increased slightly, while the share saying input is sought very often declined, suggesting that listening remains present but not more deeply embedded.
Perceptions also vary by job level. Executives are far more likely to say feedback is collected very often (39%), while entry-level employees and frontline staff are more likely to describe it as rare or inconsistent. Listening seems more integrated at higher levels of leadership than it is further down in the organization.
Feedback Frequency by Job Level
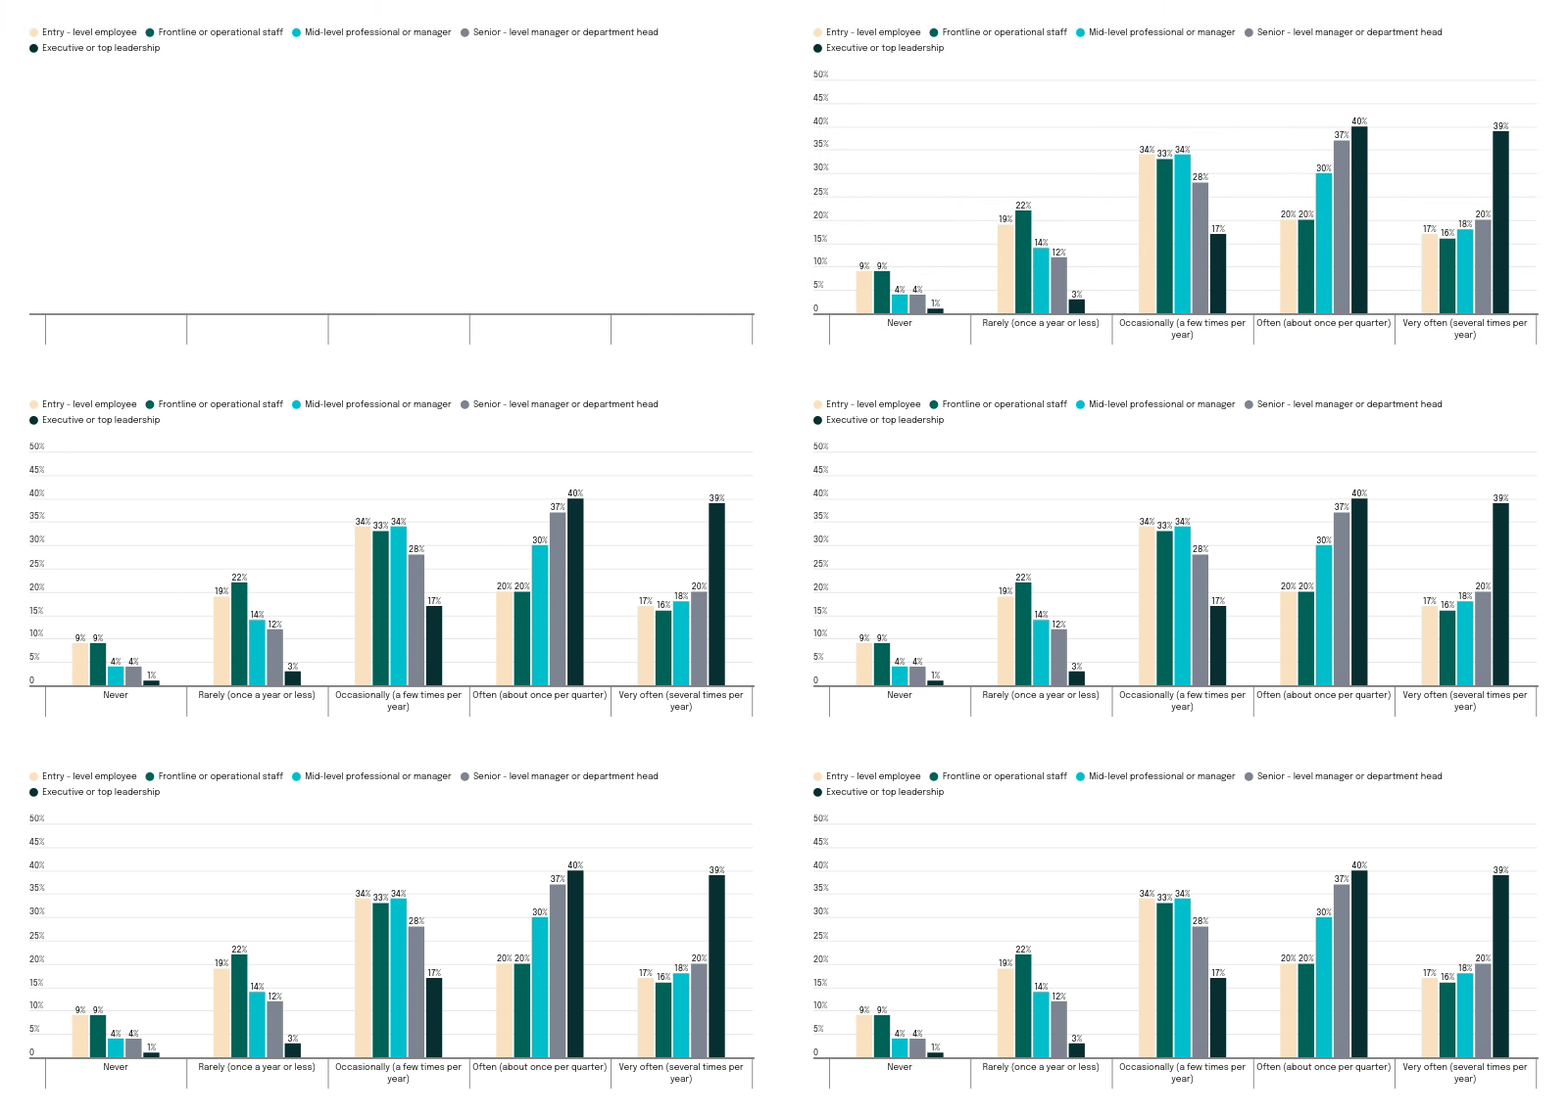
Figure 6: This graph shows how often employers seek employee input across job levels. Participants were asked to rate the frequency of feedback opportunities on a 5-point scale. Results are shown by job level. Because of rounding, the total percentage may not equal 100 percent.
Does Feedback Lead to Action
Collecting feedback does not always mean acting on it. In Q1, the largest share of employees say feedback only leads to meaningful change occasionally (33%), while just 10% say it always does. The gap between listening and follow through remains one of the clearest weak points in the employee experience.

Figure 7: This graph shows how often employees feel feedback leads to meaningful change in their workplace. Participants were asked to rate the frequency with which feedback results in action on a 5-point scale. Results are shown for Q1 2026. Because of rounding, the total percentage may not equal 100 percent.
There is little year-over-year improvement in this pattern. The percentage of participants saying feedback almost never leads to change increased by 1%, and the percentage saying it works about half the time decreased by 2 percentage points. The overall picture remains largely unchanged, with most employees still seeing inconsistent follow through after feedback is collected.
Perceptions also vary by job level. Executives are much more likely to say feedback usually or always leads to change, while entry-level and frontline employees tend to say it happens only occasionally or rarely. This indicates that follow-through is more visible near leadership than it is further down in the organization.
Perceived Impact of Feedback by Job Level
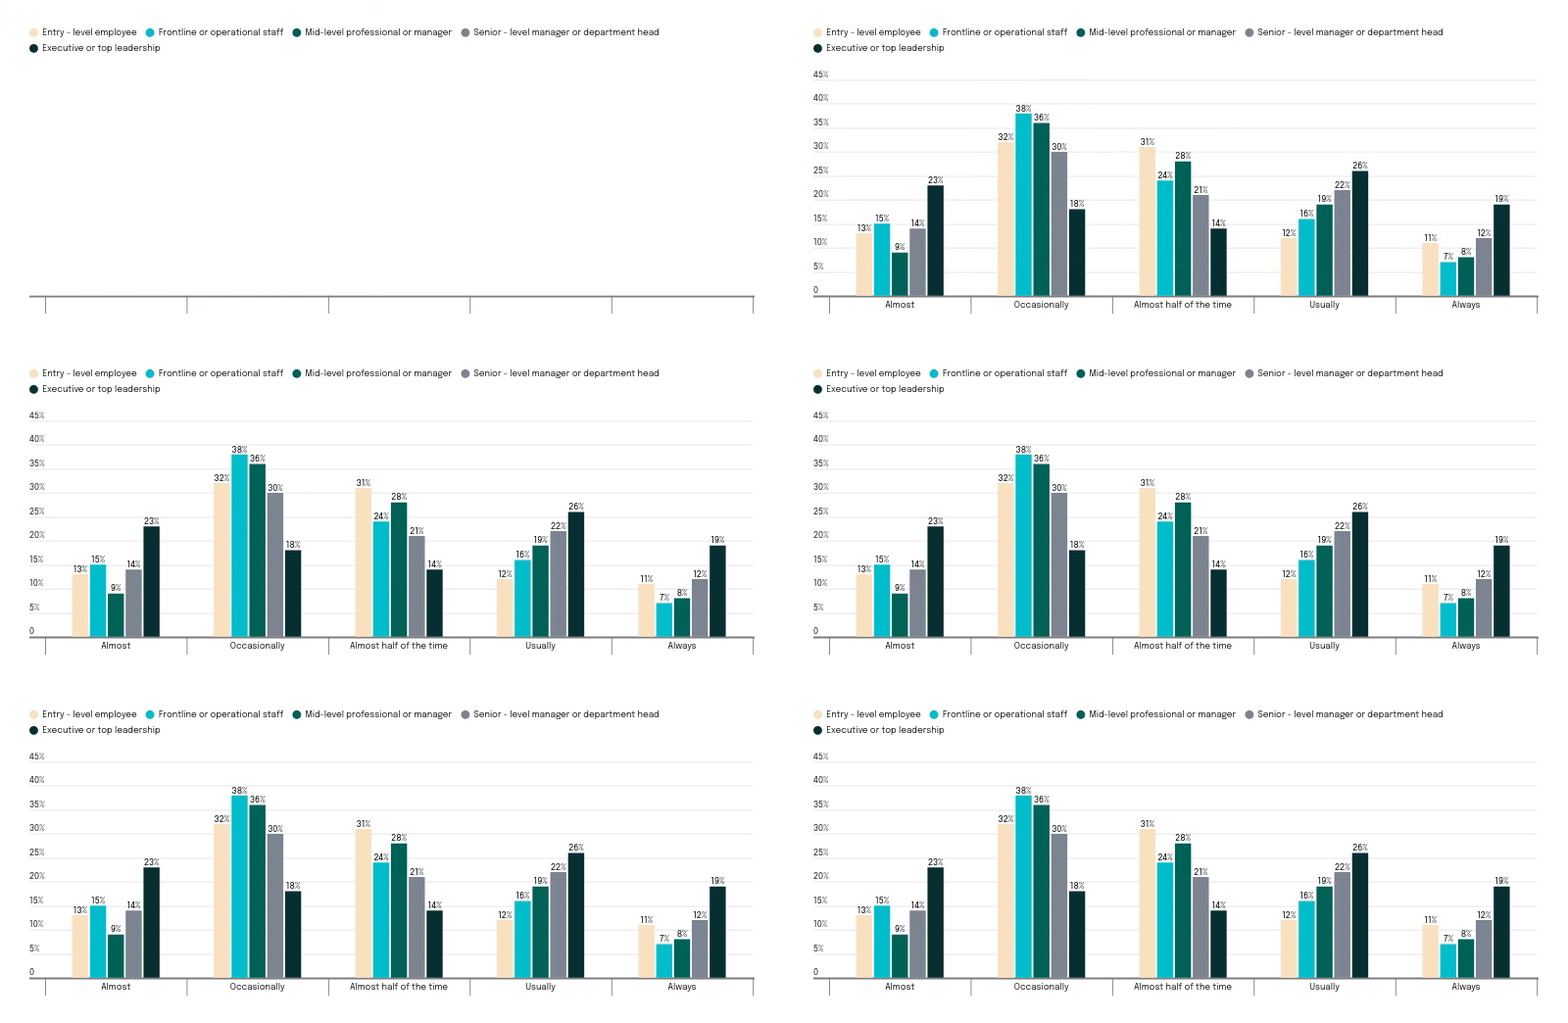
Figure 8: This graph shows how employees at different job levels perceive the frequency with which feedback leads to meaningful change in the workplace. Participants were asked to rate this on a 5-point scale. Results are shown by job level. Because of rounding, the total percentage may not equal 100 percent.
Communication Clarity
Most employees say organizational communication is at least somewhat clear, with the largest shares reporting that decisions are communicated somewhat clearly (32%) or very clearly (28%). Another 25% feel neutral, while a smaller portion perceives communication as unclear. Overall, communication is seen as generally clear, but not consistently strong across the organization.

Figure 9: This graph shows how clearly employees feel their organization communicates its decisions. Participants were asked to rate communication clarity on a 5-point scale. Results are shown for Q1 2026. Because of rounding, the total percentage may not equal 100 percent.
Year over year, there is little change in this pattern, with overall clarity holding at nearly the same level in 2025 and Q1 2026.
Perceptions of communication clarity vary much more by job level. Executives are the most likely to say decisions are communicated very clearly (51%), followed by senior managers (35%), while frontline employees are least likely to say the same (21%). This suggests that communication feels clearer closer to leadership and less clear further from the center of decision-making.
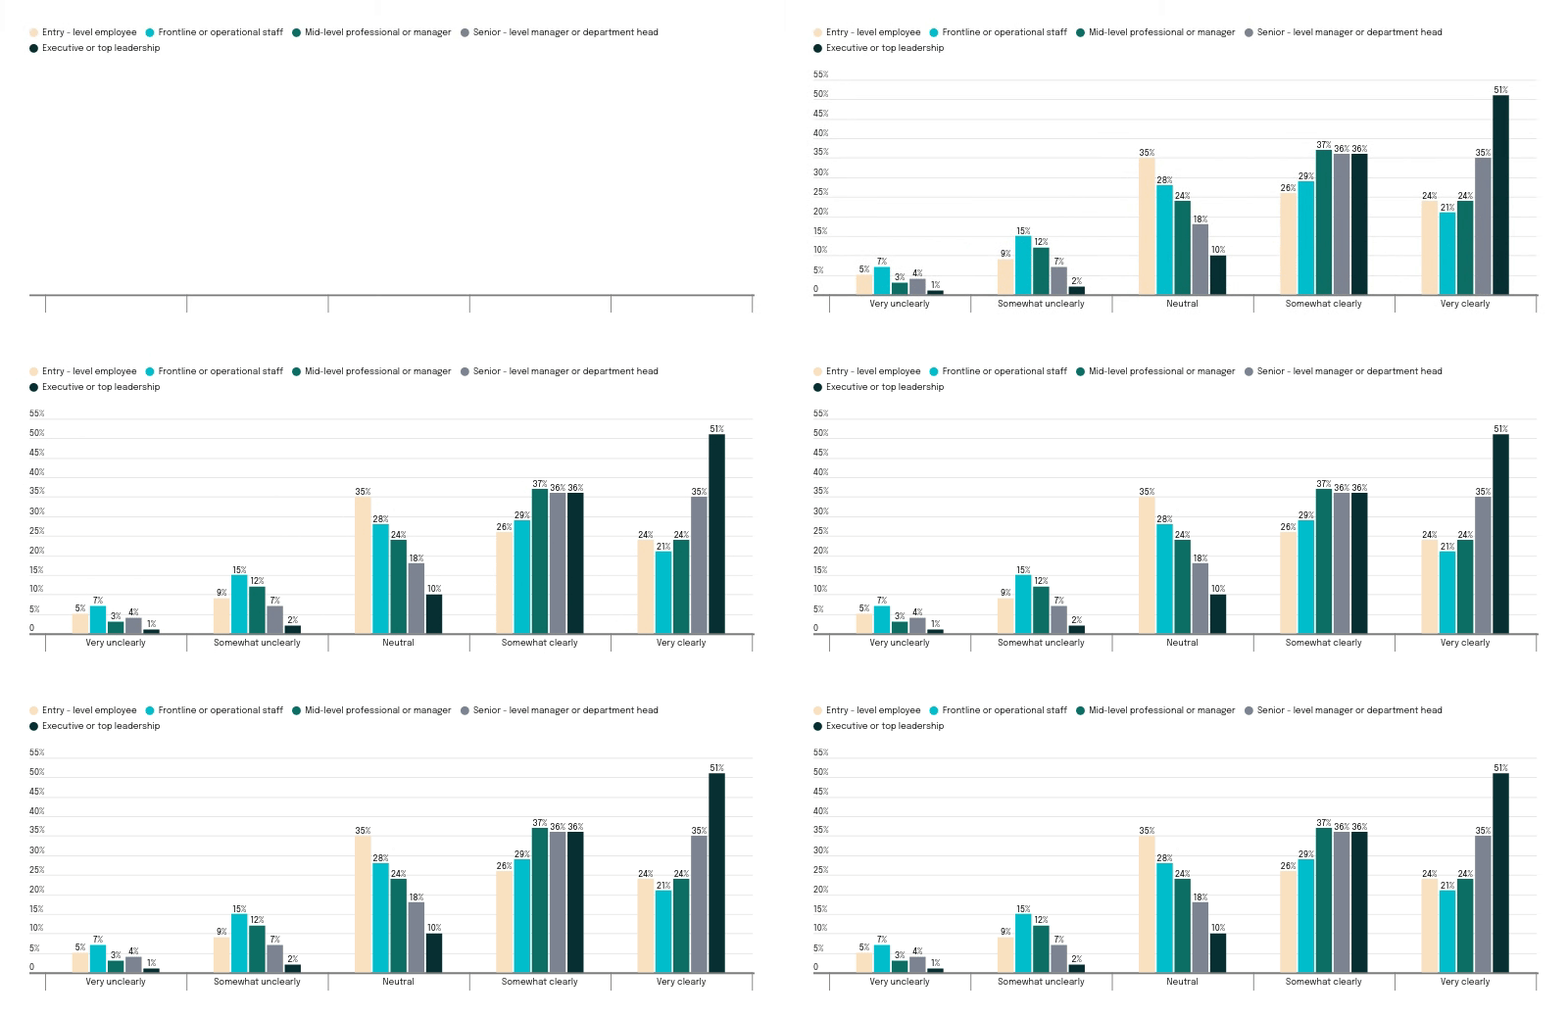
Figure 10: This graph shows how clearly employees feel their organization communicates its decisions across job levels. Participants were asked to rate communication clarity on a 5-point scale. Results are shown by job level. Because of rounding, the total percentage may not equal 100 percent.
Transparency in Decision Making
Transparency is viewed positively by many employees, but not strongly enough to feel consistent across the organization. Most employees describe organizational decision-making as at least somewhat transparent, with the largest percentage saying it is somewhat transparent (33%) or very transparent (24%). Another 24% remain neutral, while a smaller percentage say their organization is not very or not at all transparent.

Figure 11: This graph shows how transparent employees believe their organization is about the reasons and processes behind its decisions. Participants were asked to rate transparency on a 5-point scale. Results are shown for Q1 2026. Because of rounding, the total percentage may not equal 100 percent.
Year over year, there is little change in this pattern, with overall perceptions of transparency remaining nearly the same in 2025 and Q1 2026.
Perceptions of transparency vary much more by job level. Executives are the most likely to say decision-making is very transparent (44%), followed by senior managers (34%), while frontline employees are least likely to say the same (17%). This suggests that visibility into how and why decisions are made is much stronger closer to leadership.
Transparency by Job Level
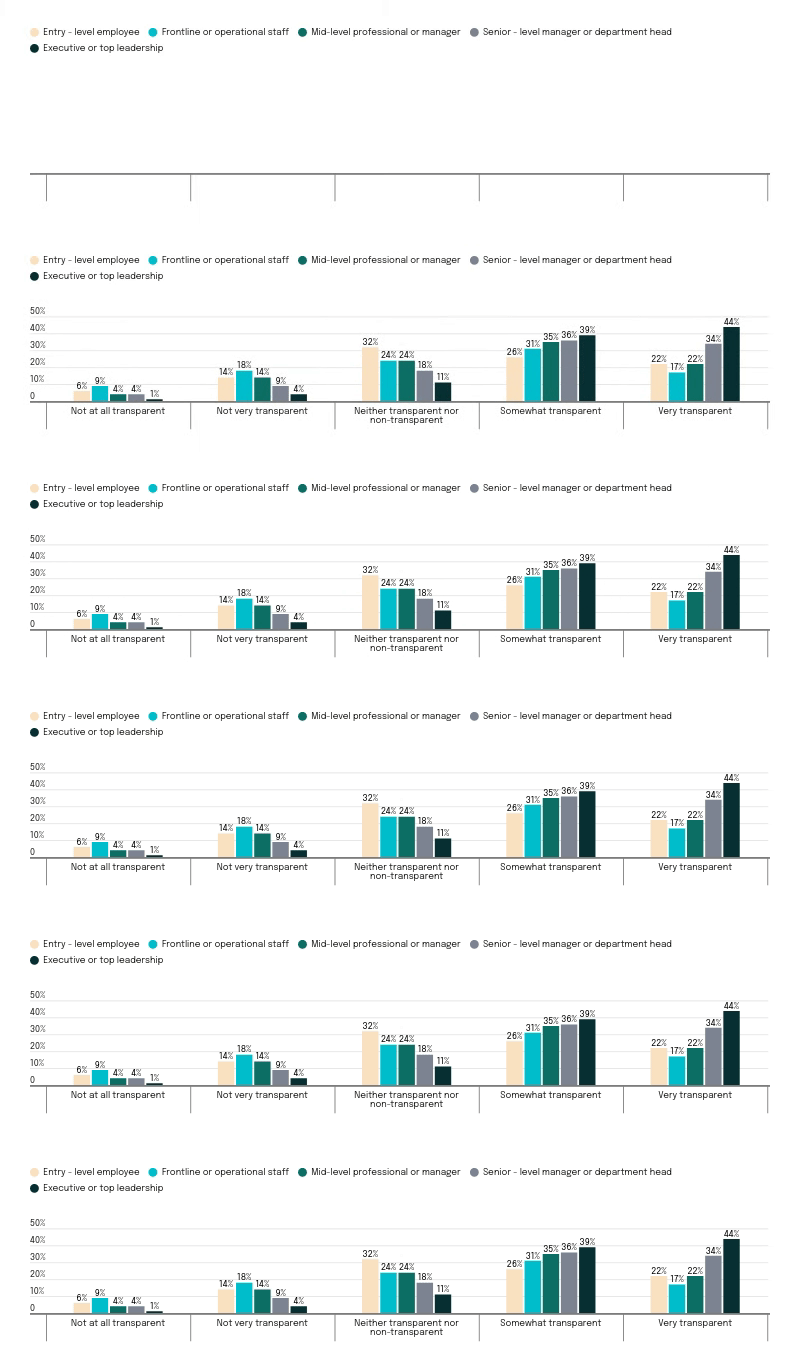
Figure 12: This graph shows how transparency in organizational decision making is perceived across job levels. Participants were asked to rate transparency on a 5-point scale from not at all transparent to very transparent. Results are shown by job level. Because of rounding, the total percentage may not equal 100 percent.
Together, these findings show that listening exists in many workplaces, but it is not being experienced evenly. Feedback, communication, and transparency are all rated more positively closer to leadership than they are lower in the organization.
When that gap persists, employees further from decision making may feel less informed, less heard, and less connected to the changes that affect their work.
Technology, AI, and the Human Experience
Technology is now part of everyday employee experience, shaping how people communicate, complete tasks, and interact with their workplace. It can improve efficiency and support daily work, but its impact is not always felt equally, and some parts of the employee experience still call for more human connection.
Impact of Technology
Technology is viewed positively by most employees, but its impact is more moderate than transformative. Most employees say workplace technology improves their experience, with the largest percentage saying it improves it somewhat (35%) or significantly (26%). Another 29% say it has no effect, while fewer say it makes their experience worse.
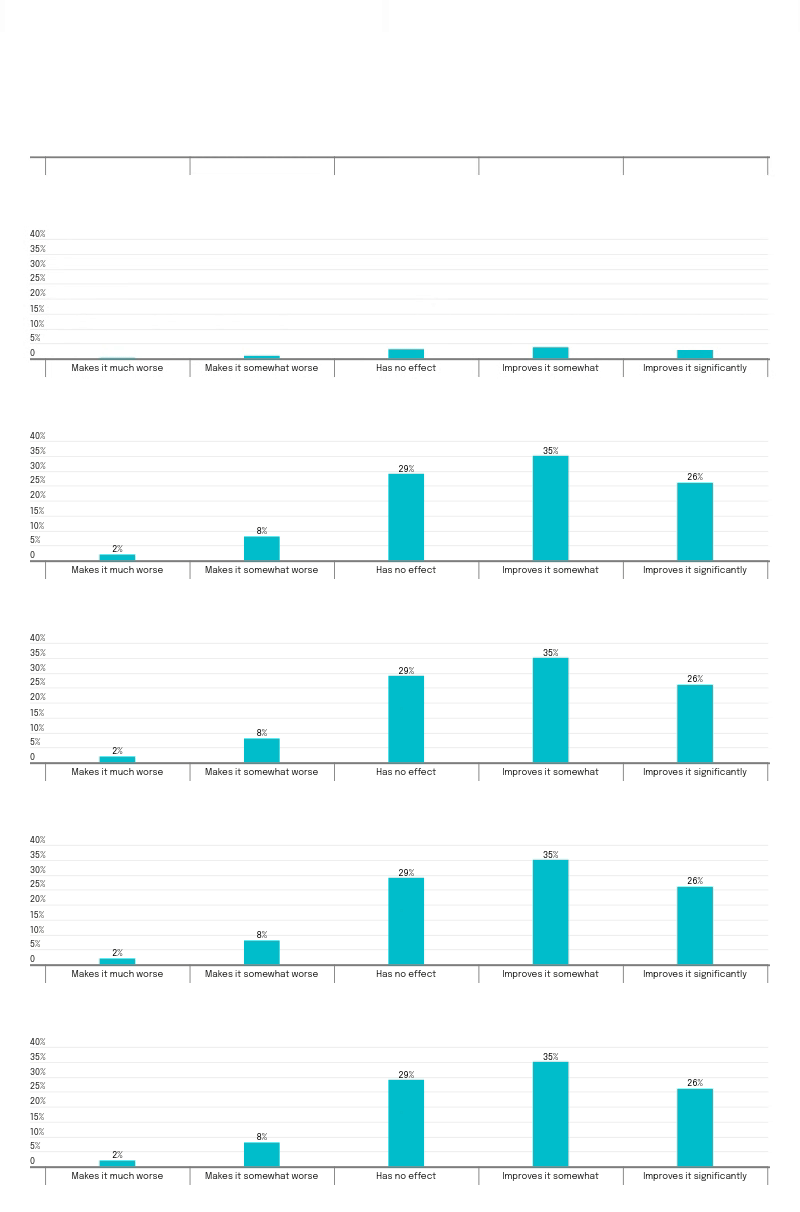
Figure 13: This graph shows how employees rate the impact of workplace technology on their overall experience. Because of rounding, the total percentage may not equal 100 percent.
Year-over-year, this pattern shows almost no change, with responses in 2025 and Q1 2026 remaining nearly identical across all categories. This suggests that employee views on workplace technology have remained consistent rather than becoming more positive or more negative.
Even among employees who say technology improves their workplace experience, many still want more human interaction in key areas, such as employee recognition and appreciation (41%), workplace communication and connection (35%), wellbeing and emotional support (35%), and team collaboration and relationship-building (35%).

Figure 14: This graph shows which parts of the work experience employees believe would be better with more human interaction instead of technology. The results are shown only for those who said workplace technology improves their experience somewhat or significantly. Because multiple answers per participant are possible, the total percentage may exceed 100 percent.
AI Perception
Employee views of AI remain mixed, with the largest percentage describing it as somewhat useful (31%), while another 25% say it makes no noticeable difference. Smaller but similar shares say AI is either a waste of time (16%) or extremely useful (15%). AI is viewed more as a limited practical tool than as a clearly positive shift in the workplace experience.
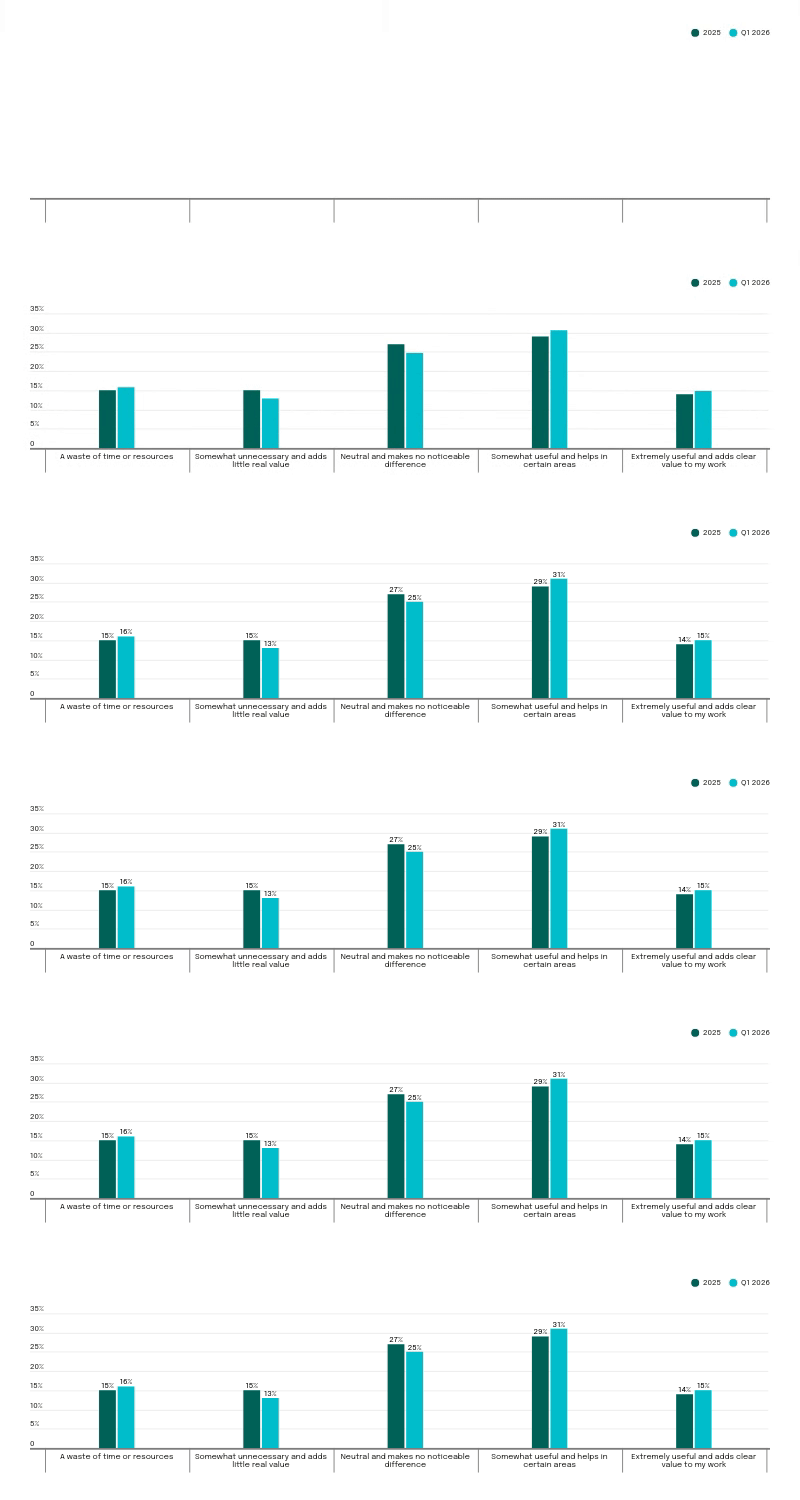
Figure 15: This graph shows how employees feel about the use of AI tools in their workplace. Results are shown for 2025 and Q1 2026. Because of rounding, the total percentage may not equal 100 percent.
Year over year, perceptions of AI show only modest movement. The share of participants describing AI as somewhat useful increased slightly by 3 percentage points, while neutrality declined by 2 percentage points, suggesting a small shift toward more defined opinions rather than a major increase in enthusiasm.
AI Benefits
Employees see the greatest value in AI in where it can improve efficiency and reduce routine workload. The strongest use cases are practical rather than strategic, pointing to a preference for AI that supports everyday work instead of replacing human judgment. Employees are most open to AI when it is used to make work faster, easier, and more manageable.
- 42% say AI will be most beneficial for improving workflow efficiency.
- 38% point to automating repetitive tasks.
- 31% identify training and development as a key benefit.
Smaller but still notable shares mention recruitment and hiring (23%) and analyzing employee feedback (22%).

Figure 16: This graph shows the workplace areas where employees believe AI will offer the greatest benefits. Participants were asked to select all areas where they think AI will be most beneficial.
Because multiple answers per participant are possible, the total percentage may exceed 100 percent.
AI Concerns
Employee concerns about AI are shaped less by the technology itself than by how it may be used in practice. The strongest concerns center on trust, accountability, and the risk of weakening human connection in the workplace. Employees are not only questioning what AI can do, but also how responsibly it will be used.
- 35% cite privacy and data protection.
- 34% point to loss of human connection and collaboration.
- 33% are concerned about lack of human oversight or accountability.
Other leading concerns include job security or possible job replacement (32%) and misuse or inaccurate use of data (30%).

Figure 17: This graph shows the concerns employees have about AI in the workplace. Participants were asked to select all concerns that apply. The graph displays only the top 10 concerns identified by employees. Because multiple answers per participant are possible, the total percentage may exceed 100
percent.
What Employees Expect
What employees once viewed as added benefits are increasingly being treated as standard workplace expectations. As those expectations become more defined, the more important question is whether employers are keeping pace with them.
Employees are most likely to view clear communication from leadership (31%), fair and transparent pay practices (28%), and support for work-life balance (26%) as basic expectations rather than perks. Career growth (24%) and flexible work hours (23%) follow closely behind. Employee expectations are centered less on extras and more on clarity, fairness, and day-to-day support.

Figure 18: This graph shows which workplace factors employees now consider basic expectations rather than perks in Q1 2026. Because multiple answers per participant are possible, the total percentage may exceed 100 percent.
Compared with 2025, a few expectations have become more prominent in Q1 2026. Clear communication from leadership, mental health and wellbeing support, and regular feedback and check-ins all increased by 3 percentage points.
Retention and Risk Signals
Intent to stay can suggest stability, but it does not remove the conditions that make employees open to leaving. Looking at both retention intent and exit triggers gives a clearer view of how secure that stability really is.
Likelihood to Stay
Most employees say they are likely to stay with their current employer over the next year, with 60% saying they are very likely to stay. Smaller shares say they are unsure (15%), neither likely nor unlikely (12%), or somewhat unlikely (8%), while only 5% say they are very unlikely to stay. Retention appears strong on the surface, with most employees expressing a clear intention to remain.

Figure 19: This graph shows how likely employees are to stay with their current employer over the next year. Participants were asked to rate this on a 5-point scale. Because of rounding, the total percentage may not equal 100 percent.
Drivers of Leaving
The risk picture becomes more complicated when participants are asked what could make them leave. Even among those who say they are very likely to stay, 46% say better pay and benefits elsewhere could make them leave, followed by poor leadership or workplace culture (27%), feeling undervalued (25%), and job insecurity or organizational instability (24%). Intent to stay does not eliminate underlying turnover risk.

Figure 20: This graph shows which factors could make respondents consider leaving their current employer. The results are shown only for participants who said they are very likely to stay with their current employer over the next year. Because multiple answers per participant are possible, the total percentage may exceed 100 percent.
Retention looks stable at the surface, but the risk of turnover has not disappeared. Employees may not be actively planning to leave, yet many remain sensitive to better offers and workplace conditions that weaken their sense of value, stability, or trust.
Survey respondents are looking ahead with a clearer view of what future workplaces should offer and what could undermine that progress. The next phase of employee experience will be shaped by the balance between flexibility, support, and how responsibly change is managed.
What Will Define the Next Workplace
Participants are most likely to say a workplace would stand out for offering personalized benefits and rewards (33%) or a four-day workweek/compressed schedule (32%). Unlimited paid time off (25%), continuous learning and reskilling opportunities (24%), and profit sharing or employee ownership (22%) also rank highly. The workplace of the future is being defined less by traditional perks and more by flexibility, personalization, and shared value.
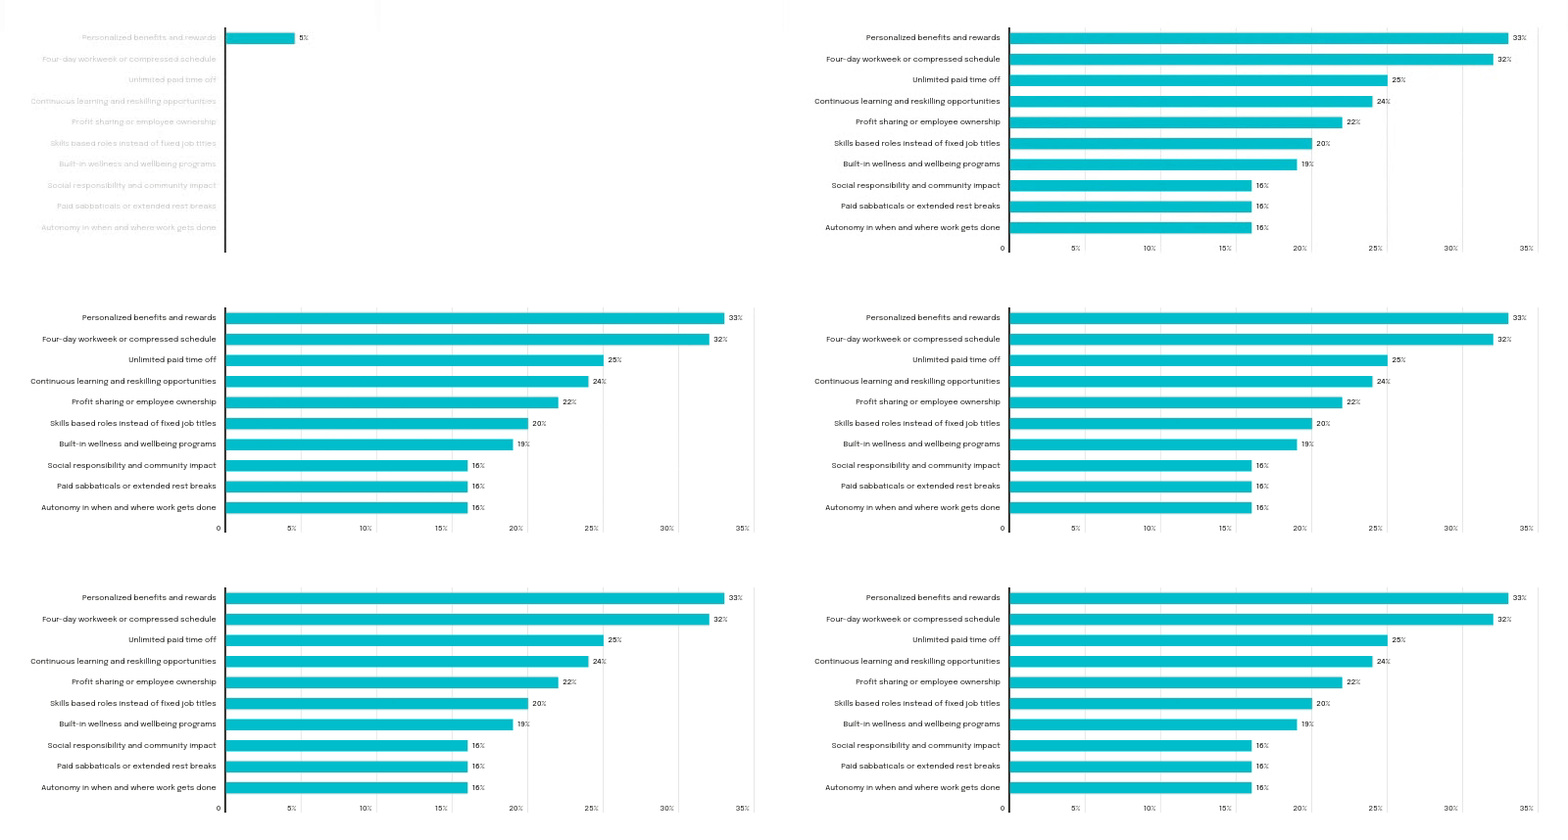
Figure 21: This graph shows which features respondents believe would make a company stand out as a great place to work in the next few years. This graph displays only the top 10 responses identified by employees. Because multiple answers per participant are possible, the total percentage may exceed 100
percent.
The Strongest Concerns About the Future of Work
Survey participants’ concerns are led by AI-driven decisions without human oversight (31%) and job security or possible job replacement (31%). Decline in human connection at work (28%), rising pressure to maintain constant productivity (24%), and privacy and data protection concerns (22%) follow closely behind. The strongest future concerns are not only about technology itself, but about control, security, and what may be lost as work changes.

Figure 22: This graph shows which emerging workplace trends worry employees most. Participants were asked to select all options that apply. Because multiple answers per participant are possible, the total percentage may exceed 100 percent.
How Ready Workplaces Seem
Most employees stop short of expressing strong confidence that their organizations are ready for these future expectations. The largest shares say their workplace is somewhat ready (32%) or neutral (31%), while only 21% say it is very ready. Employees see some readiness, but not enough to suggest strong confidence in how well workplaces will meet future expectations.

Figure 23: This graph shows how ready employees believe their organization is to deliver on future workplace expectations. Participants were asked to rate readiness on a 5-point scale. Because of rounding, the total percentage may not equal 100 percent.
What Employers Should Do Next
Employee expectations become clearer through verbatim feedback on what employers should do differently, helping pinpoint where employees see the most pressing opportunities for improvement.
Strengthen pay, value, and fairness
Compensation remains the clearest action area. Employees repeatedly caled for better pay, stronger benefits, raises, and fairer reward systems tied to effort and contribution. As one response put it, “give fair pay based on our effort.” Another said, “Salary should be awarded by skil set not by whether you have a degree or not.”
Communicate more clearly and follow through
Employees want clearer communication, but they also want proof that leadership listens and acts. Several responses focused on the gap between asking for input and doing something with it. One employee wrote, “Listen to us and don’t say we will work on that and they do nothing.” Another said, “Improve communication and follow through on employee feedback so people feel heard and see real changes.”
Protect balance and flexibility
Flexibility is no longer treated as an extra. Employees want more control over schedules, stronger support for work life balance, more time off, and workload expectations that feel sustainable. One response called for “more flexibility in work options,” while another asked for, “a proper policy to better help employees with their work life balance.”
Invest in growth and practical development
Employees want more than static roles. They are asking for better training, more career development, stronger professional growth opportunities, and support in building relevant new skills. One response asked for “more flexible work options and opportunities for professional growth.” Another caled for “better training programs rather than just an arbitrary number of training hours.”
Lead with respect, trust, and accountability
Many comments point to a deeper need for leadership that is fair, considerate, and responsive. Employees want to feel respected, not micromanaged or overlooked. One response said, “Value their employees and not treat them like dirt.” Another caled for “greater transparency of leadership,” while one employee simply said, “Be a better leader.”
The clearest message from these responses is that employees are not asking for more promises. They are asking for employers to deliver more clearly, more fairly, and more consistently on the things that matter most.