
About the Study
This report is based on findings from a Q1 2026 survey of U.S. consumers, with comparisons to 2025 data to highlight emerging trends in customer experience. The results show that while companies can deliver strong individual experiences, consistency, trust, and follow through remain ongoing challenges.
Customers today prioritize reliability over novelty. They expect fast, seamless interactions, clear communication, and fair value, while
remaining cautious about how their data is used. Loyalty is still present, but increasingly conditional, shaped by each interaction
rather than long-term brand attachment.

Looking ahead, the next phase of customer experience will be defined by trust, affordability, and consistent delivery across every interaction.
Framing the evolving challenge of customer experience.
Customer experience has reached a point where delivering a single great interaction is no longer enough. Customers now evaluate brands based on how consistently they deliver across every touchpoint, and even small gaps between expectation and reality are becoming more visible.
At the same time, the nature of expectations is changing. Customers are no longer focused only on speed or convenience. They are placing increasing importance on transparency, fair pricing, responsible data use, and the ability to engage with companies in ways that feel both efficient and human.
This creates a growing challenge for organizations. Technology has made it easier to scale experiences, but harder to maintain consistency, trust, and meaningful interaction. As automation expands, companies must balance efficiency with empathy, ensuring that convenience does not come at the cost of clarity or control.
The gap between what customers expect and what companies consistently deliver continues to widen. This report examines how expectations are evolving, where companies are meeting or falling short, and what will define effective customer experience in the years ahead.
This report is based on insights from two Sogolytics surveys conducted among U.S. consumers, including the 2025 annual study and the Q1 2026 wave. The combined analysis provides both a longitudinal view of changing customer expectations and a current snapshot of experience trends.
A total of 1,000+ participants were surveyed in each wave, with quotas applied to ensure balanced representation by age, gender, and geography across the United States. Participants were required to have had at least one meaningful customer experience within the past 12 months.
The survey included a mix of question types, including single-select, multi-select, Likert scale, ranking, and open-ended questions, designed to capture both quantitative trends and qualitative insights. Results reflect self-reported perceptions of customer experience, expectations, trust, and behavior across major industries.

The State of CX
Customer experience today is shaped by frequent, everyday interactions across key industries. Retail (24%) and healthcare (20%) account for the largest share of recent experiences. Financial services (13%) and entertainment (12%) follow, with smaller contributions from other sectors.

Figure 1: This graph shows the industries in which participants reported their most recent meaningful customer experience, whether positive or negative.
Satisfaction: Recent vs Overall
77% report being satisfied with their most recent experience, compared to 68% overall. Overall satisfaction has improved since last year, with more customers now reporting positive experiences. This gap shows that companies can deliver strong moments, but consistency remains a challenge.

Figure 2: This graph shows how participants rated satisfaction with their most recent meaningful customer experience. Results are shown for Q1 2026 and full year 2025. Because of rounding, the total percentage may not equal 100%.

Figure 3: This graph shows how participants rated their overall satisfaction with customer experiences across companies today. Responses have been grouped into satisfied, neutral, and dissatisfied categories. Results are shown for Q1 2026 and full year 2025.
Industry CX Rankings
Financial services rank highest in customer experience in Q1, followed by entertainment and healthcare. Financial services also held the top position in the previous wave, showing consistent performance. Telecommunications and travel rank lowest, highlighting continued challenges in these sectors.

Figure 4: This graph shows how participants ranked industries based on the overall quality of customer experience they provide, with 1 being the best and 9 being the worst. Rankings are based on relative weighted scores.
Expectations and Experience Gaps
Customer expectations continue to rise, creating a growing gap between what customers expect and what they receive. As expectations increase, delivering consistent experiences becomes more challenging across industries.
How Expectations Are Changing
Customer expectations continue to rise, with more respondents reporting higher expectations compared to five years ago. 53% say their expectations are now higher, up from 44% in the previous wave, highlighting rising expectations for better customer experience.

Figure 5: This graph shows how participants rated their current customer experience expectations compared to five years ago. Results are shown for Q1 2026 and 2025. Because of rounding, the total percentage may not equal 100%.
What Customers Expect in 2026
Customer expectations have expanded across multiple dimensions, with no single factor standing out alone. Privacy and data protection lead, with 37% strongly agreeing they expect greater respect for their data. Ethics (31%) and transparency (30%) follow closely, while demand for speed, personalization, and human connection remains consistently high.

Figure 6: This graph shows how participants rated their agreement with statements describing how their customer experience expectations have evolved over the past five years. Participants responded on a five-point scale from strongly disagree to strongly agree. Because of rounding, the total percentage may not equal 100%.
Customer expectations continue to rise, while overall experience remains more moderate. High expectations for speed, transparency, and trust are not always matched by current experiences. This gap increases pressure on companies to deliver reliable experiences at scale.
What Defines Great and Poor Experiences
Customer experience is shaped by a consistent set of core drivers. The same factors that create strong experiences also influence how customers evaluate and compare brands.
Drivers of Great Experiences
Great experiences are driven by a combination of speed, communication, and human interaction. Fast response and resolution (31%) remain the top driver, followed closely by clear communication (30%) and empathy (29%). Trust and reliability also play a strong role, showing that customers value both efficiency and confidence in their interactions.

Figure 7: This graph shows the factors participants selected as making their best recent customer experiences stand out. Participants were allowed to select multiple responses. Because of multiple responses, the total percentage may exceed 100%.
Drivers of Poor Experiences
Poor experiences are driven by delays, poor communication, and lack of transparency. Long wait times (35%) and poor communication (34%) are the most common issues, followed by hidden fees (29%) and unresolved problems (28%). These breakdowns highlight how quickly trust can be lost when expectations around speed, clarity, and accountability are not met.

Figure 8: This graph shows the factors participants selected as making their worst recent customer experiences stand out. Participants were allowed to select multiple responses. Because of multiple responses, the total percentage may exceed 100%.
The same factors that define great experiences also drive poor ones when they fail. Speed, communication, and empathy appear on both sides, either strengthening or weakening the overal experience. This symmetry highlights that customer experience is shaped less by new features and more by consistently delivering the fundamentals.
AI and the Human Balance
Overall Sentiment Toward AI
Customer sentiment toward AI remains divided, with most viewing it as a mix of benefits and drawbacks. 30% say AI has both positive and negative effects, while 22% say it improves the experience and 22% say it harms it.
Compared to last year, a larger share of customers now view AI positively, while fewer remain unsure, suggesting a shift toward more defined and increasingly favorable perceptions of AI in customer experience. The biggest % change is that more people have positive perceptions than last quarter. That might be the beginning of a trend.

Figure 9: This graph shows how participants feel about the use of automation and AI in customer experience. Results are shown for Q1 2026 and 2025. Because of rounding, the total percentage may not equal 100%.
Willingness to Use AI for Speed
Customers show growing willingness to use AI when it improves speed and convenience. 55% agree they are willing to use automated tools for faster experiences, up from 43% last year. At the same time, a smaller share remains neutral, suggesting increasing comfort with AI-driven interactions.

Figure 10: This graph shows how participants rated their willingness to use automated chats and AI tools if it results in faster and smoother experiences. Results are shown for Q1 2026 and 2025. Because of rounding, the total percentage may not equal 100%.
Concerns About AI
Concerns around AI remain centered on trust, accuracy, and human connection. Accuracy (39%), loss of human interaction (38%), and lack of empathy (37%) are the most common concerns, alongside privacy risks (37%). These concerns highlight that while AI offers efficiency, customers stil question its reliability and human impact.

Figure 11: This graph shows the concerns participants have about using automated or AI-driven experiences. Participants were allowed to select multiple responses. Because of multiple responses, the total percentage may exceed 100%.
Where Human Interaction Still Matters
Customers continue to prefer human interaction in high-stakes and sensitive situations. Healthcare (52%), emotional scenarios (46%), and financial discussions (45%) are the top areas where human involvement is preferred. Human interaction remains critical in situations that involve trust, complexity, or emotion.
While these preferences remain consistent, the share of customers preferring human interaction has declined slightly across most areas compared to last year. Customers are becoming more open to automation, even in traditionally human-led contexts.

Figure 12: This graph shows the areas where participants prefer human interaction, even if it results in slower experiences. Participants were allowed to select multiple responses. Results are shown for Q1 2026 and 2025. Because of multiple responses, the total percentage may exceed 100%.
Personalization, Privacy, and Trust
Customer experience is increasingly shaped by how well companies balance personalization with trust. As expectations for tailored experiences grow, delivery is improving, but not uniformly across all customers.
Importance vs Satisfaction with Personalization
Personalization is important to customers, and satisfaction is beginning to catch up. 58% rate personalization as very or extremely important, while 59% report being satisfied with what they receive. The gap between expectations and delivery is narrowing but not fully closed. Satisfaction has improved compared to last year, increasing by 8 percentage points. Customers who value personalization the most are also more likely to report higher satisfaction.

Figure 13: This graph shows how participants rated the importance of personalized experiences, such as tailored recommendations and customized communication. Results are shown for Q1 2026 and 2025. Because of rounding, the total percentage may not equal 100%.
Satisfaction with Personalization (Q1 2026 vs 2025)

Figure 14: This graph shows how participants rated their satisfaction with the level of personalization they currently receive in their customer experiences. Results are shown for Q1 2026 and 2025. Because of rounding, the total percentage may not equal 100%.
Comfort with Data Use
Customer comfort with data use is increasing, though hesitation remains. 42% report being comfortable with companies using their data, up from 32% last year. Fewer customers now report discomfort, indicating a gradual shift toward greater trust. At the same time, a significant share still remains neutral or uncomfortable, showing that confidence in data use is still developing.

Figure 15: This graph shows how comfortable participants are with companies collecting and using their personal data to improve their experience. Participants rated their comfort on a five-point scale. Results are shown for Q1 2026 and 2025. Because of rounding, the total percentage may not equal 100%.
Personalization is gaining ground, but trust remains the deciding factor. As customers become more open to data-driven experiences, transparency and responsible data use are increasingly shaping long-term engagement.
Trust, Transparency, and Data Behavior
Customer trust in data practices remains cautious, but expectations around transparency are clear. Only 17% strongly agree they trust companies to protect their data, while 43% strongly agree that companies should be more transparent. Transparency is no longer optional; it is a key driver of trust and loyalty.
46% say they would stop using a company if their data is sold without consent, and 68% say they are at least somewhat more loyal to brands that clearly explain their data practices. Customers are willing to reward transparency, and quick to penalize misuse of data.

Figure 16: This graph shows how participants rated their agreement with statements related to trust in data protection, transparency in data use, and how data practices influence their behavior and loyalty. Participants responded on a five-point scale. Because of rounding, the total percentage may not equal 100%.
Building and Maintaining Trust
Trust continues to play a central role in shaping customer relationships. As expectations rise, companies are increasingly judged not just on performance, but on how consistently they communicate, act, and deliver on their promises.
Core Drivers of Trust
Trust is primarily shaped by how companies communicate and interact with customers, with honest communication (41%) and respectful treatment (38%) ranking as the top drivers, followed by data protection (35%) and transparent pricing (32%). Functional factors like product quality and problem resolution remain important but play a secondary role compared to these leading drivers. Trust is driven more by transparency and treatment than by performance alone.

Figure 17: This graph shows the factors that most influence participants’ trust in a company. Participants were allowed to select multiple responses. Because of multiple responses, the total percentage may exceed 100%.
Influence of Company Values
Company values play a moderate role in shaping customer decisions, with most respondents indicating a somewhat significant influence across social, environmental, and political factors. Social (71%) and environmental (69%) stances have slightly higher influence compared to political stance (64%).
Company values matter, but they are not the primary drivers of trust or decision-making.
Compared to last year, the influence of these factors has increased slightly, particularly for social and environmental issues. Values are becoming more relevant but remain secondary to core experience factors.
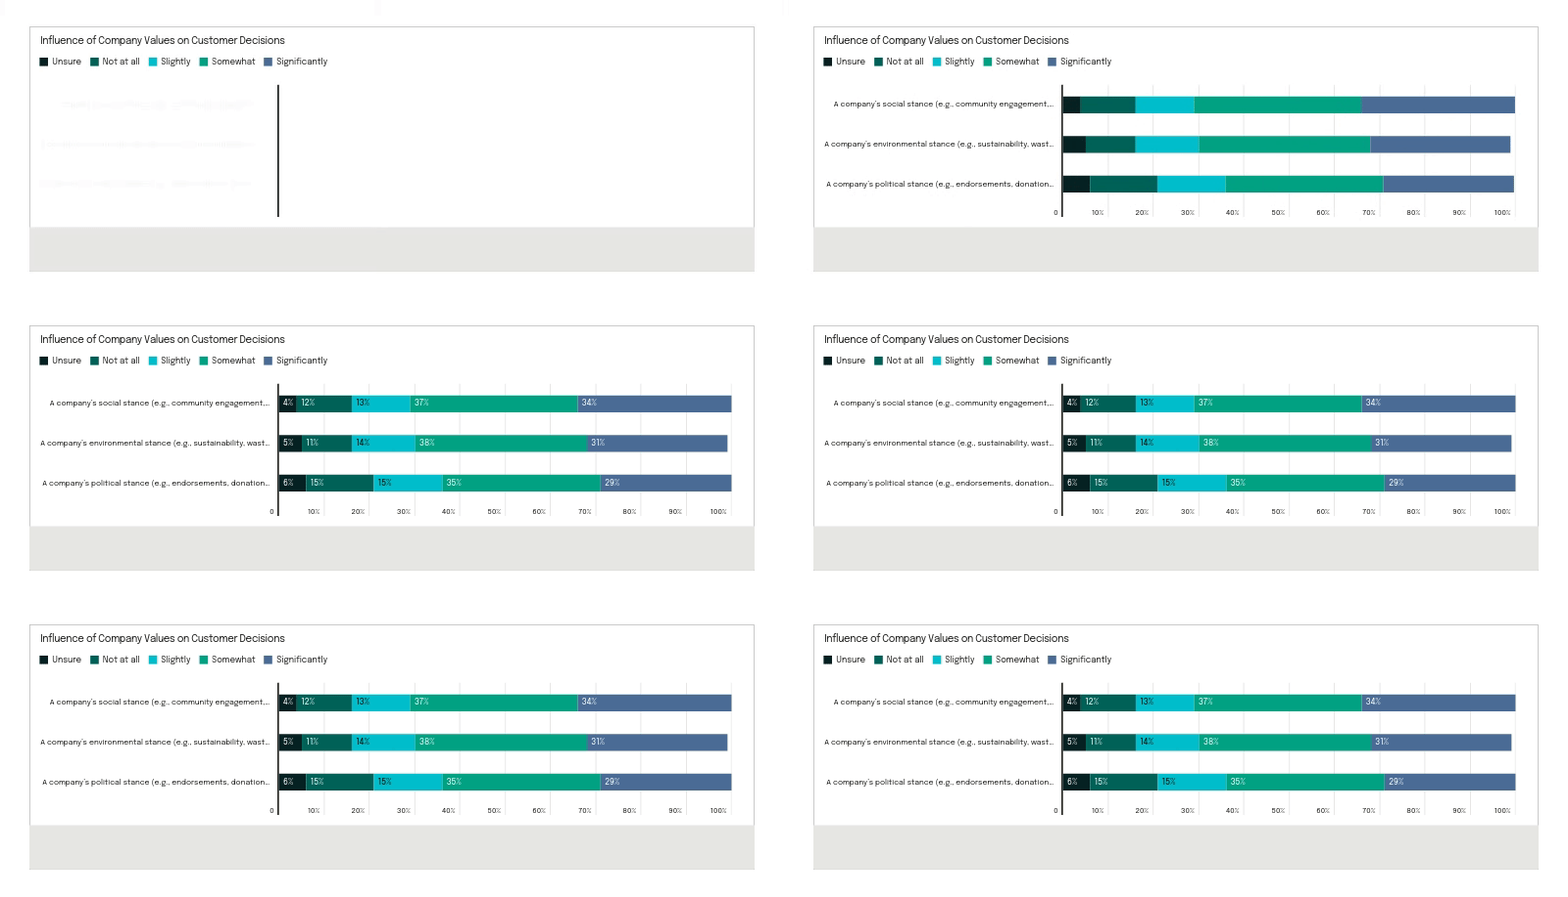
Figure 18: This graph shows how participants rated the influence of a company’s social, environmental, and political stance on their overall experience and purchasing decisions. Results reflect Q1 2026 responses. Because of rounding, the total percentage may not equal 100%.
Feedback and Action Loops
Customer feedback is a key part of the experience, shaping how companies understand and respond to their customers.
How feedback is shared and whether it leads to action both play a critical role in closing the experience loop.
How Customers Share Feedback
Customers use a variety of channels to share feedback, with email (45%) being the most preferred method. Text messages (29%) and phone calls (28%) follow, while digital channels like social media and in-app surveys are also widely used. Feedback is shared across channels, not limited to a single touchpoint.

Figure 19: This graph shows how participants prefer to share feedback about their experiences with companies. Participants were allowed to select multiple responses. Because of multiple responses, the total percentage may exceed 100%.
Does Feedback Lead to Action
Feedback does not always translate into clear action. Only 34% say their feedback led to visible improvements, while 30% report only minor or unclear changes. There is a significant share of customers who do not see meaningful outcomes from the feedback they provide. This gap highlights a missed opportunity for companies to strengthen trust through visible action.
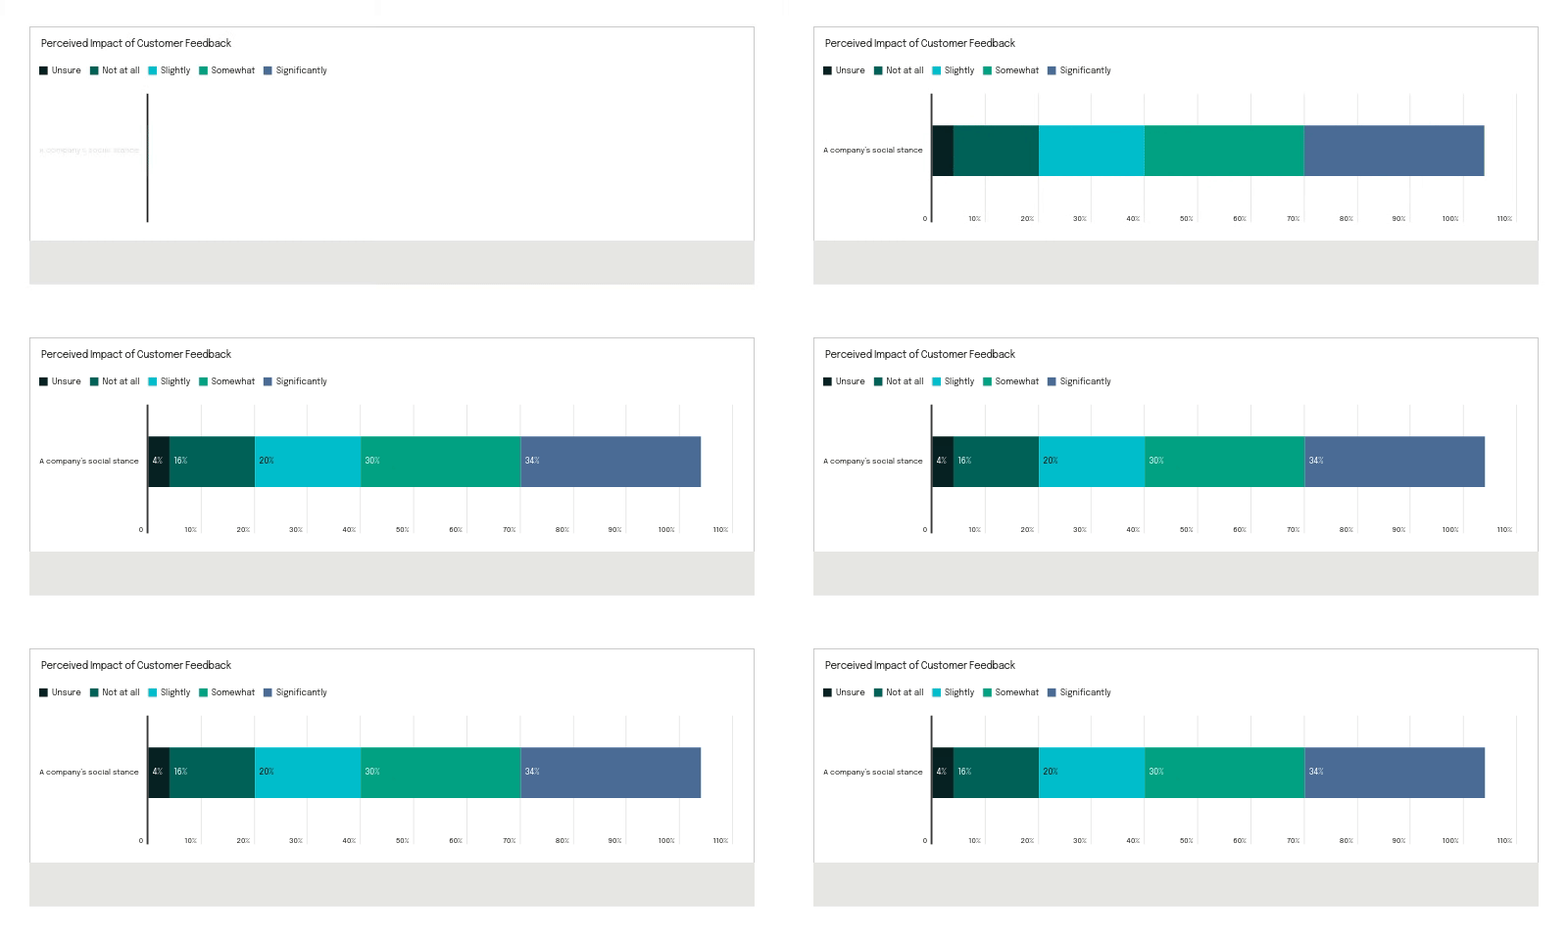
Figure 20: This graph shows whether participants felt their feedback led to visible action or improvement. Because of rounding, the total percentage may not equal 100%.
Customers are willing to share feedback across channels, but the impact of that feedback is not always clear. When feedback does not lead to visible action, it weakens trust and engagement. Closing the loop remains one of the biggest opportunities to strengthen customer experience.
Loyalty and Switching Behavior
Customer loyalty exists on a spectrum, influenced by both ongoing experiences and individual interactions. Understanding how customers define loyalty and how they respond to negative experiences provides insight into how stable that loyalty really is.
Self-Reported Loyalty
Most customers describe themselves as somewhat loyal rather than fully committed. 43% say they are somewhat loyal, while 31% consider themselves very loyal. Loyalty is shifting from strong commitment to more flexible preference.
Compared to last year, fewer customers identify as very loyal, while more fall into the somewhat loyal category, suggesting that loyalty is becoming less firm and more conditional.

Figure 21: This graph shows how participants described their level of loyalty to brands, ranging from very loyal to very disloyal. Results reflect Q1 2026 responses. Because of rounding, the total percentage may not equal 100%.
Reaction to Negative Experiences
Customers show moderate tolerance for negative experiences, but switching risk remains significant. 37% say they are likely to switch after a single negative experience, compared to 31% who say they are unlikely to do so, indicating that tolerance exists but is limited. Customer loyalty is increasingly conditional, with a single negative experience often putting it at risk. Compared to last year, the likelihood of switching has increased slightly, indicating reduced tolerance for poor experiences.

Figure 22: This graph shows how likely participants are to switch to a competitor after a single negative experience with a brand. Participants rated their likelihood on a five-point scale. Results reflect Q1 2026 responses. Because of rounding, the total percentage may not equal 100%.
Drivers of Long-Term Loyalty
Loyalty is driven more by value and performance than by brand values or personalization. Long-term loyalty is shaped primarily by practical, performance-based factors, with affordability (20%), product or service quality (19%), and customer service (18%) leading, followed by trust and transparency (13%).
Factors such as brand values, convenience, and personalization play a secondary role, reinforcing that customers prioritize
consistent, tangible outcomes when deciding to stay with a brand.

Figure 23: This graph shows the single most important factor influencing participants’ long-term loyalty to a brand. Results reflect Q1 2026 responses. Because of rounding, the total percentage may not equal 100%. Customer loyalty is becoming more conditional and experience driven. Brands that deliver consistent value retain customers, while those that fall short risk losing them quickly.
The Future of CX
Top Priorities for the Next Decade
Customer priorities are shifting toward trust, value, and reliability over time, with protecting customer data (44%) and reducing costs (41%) emerging as the top focus areas for the next decade, folowed by faster service (29%) and greater transparency (28%).
While factors like balancing automation with human interaction and building brand trust remain important, personalization ranks lower, indicating a shift away from surface-level enhancements toward more meaningful and reliable experiences. The future of customer experience will be defined by trust, affordability, and consistent performance.

Figure 24: This graph shows the areas participants believe companies should focus on most over the next 10 years to improve customer experience. Because multiple responses were permitted, the total percentage may exceed 100%.
What Great CX Looks Like
Customers consistently describe great experiences as fast, simple, and human. They value interactions that resolve issues quickly, feel easy to navigate, and are grounded in honesty and respect. While expectations continue to evolve, the fundamentals of good service remain unchanged.
- Fast, decisive resolution
“Fast efficient resolution.”
Resolve issues quickly and minimize the number
of steps required to reach a solution.
- Human support when it matters
“Talking to a real person that can help with what
customers need.”
Ensure customers can easily reach a real person
when issues are complex, urgent, or sensitive.
- Honest and transparent communication
“Just being honest with customers.”
Set clear expectations and communicate openly
about pricing, timelines, and outcomes.
- Seamless and effortless interactions
“Easy to use and secure website.”
Design experiences that are intuitive, reliable, and
free from unnecessary friction.
- Fair pricing and clear value
“Fair pricing, honesty and quality in customer service.”
Keep pricing simple and transparent, while clearly
demonstrating the value delivered.
Great customer experience is defined by consistently delivering fast, seamless, and transparent interactions, supported by human assistance when it matters most.