Sprint release cycles mean there’s always more to explore! Check out a few of our clients’ favorite highlights in our 32.1 release!
Link responses directly to Directories to add value
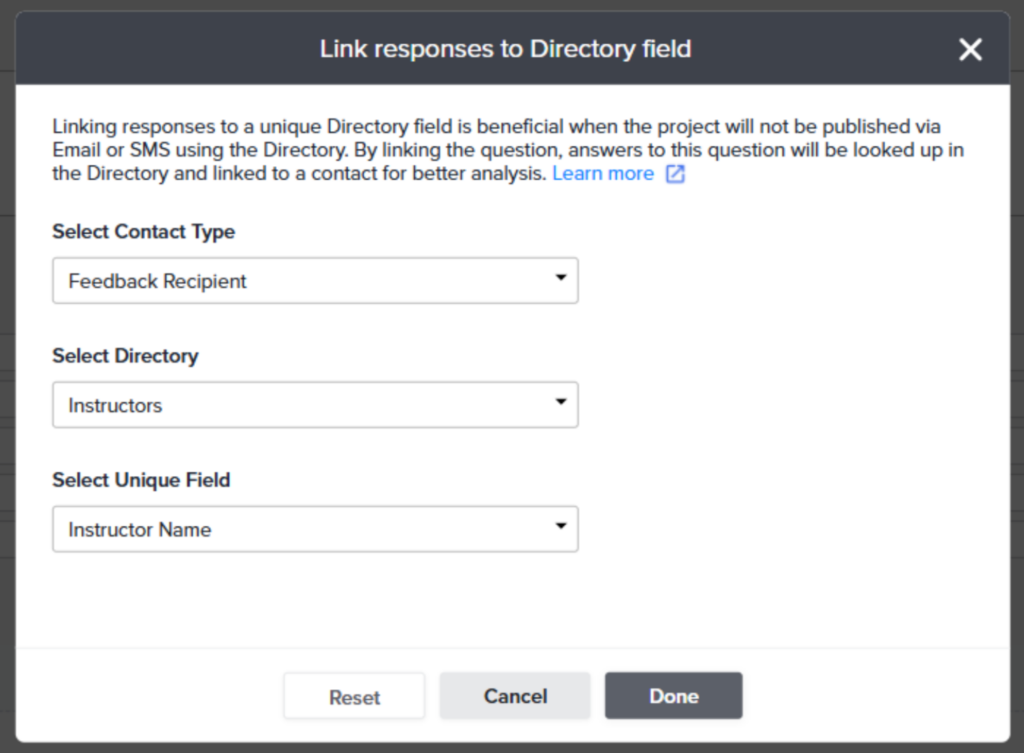
- Enhancements to the ability to link responses to Directory within Design
If you haven’t yet explored Directories, now’s the time! Think of Directories as super-charged Contact Lists with special powers. As survey responses come in, you can now link each response to the relevant Contact (either the actual respondent or even someone they’re giving feedback about!) by matching up the key identifier field. Why? This allows you to reduce the amount of data you might want to pre-populate while still enabling you to use relevant known data in reporting.
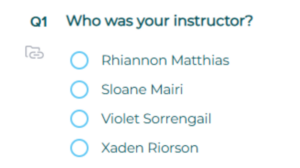
Here’s an example: Let’s say you have a team of 50 instructors who teach a variety of courses across the nation. You, as the survey administrator, know a lot of information about your instructors that wouldn’t be asked in the survey – like the region they serve or the length of time they’ve been an instructor. These details get added to each Contact in your instructor Directory.
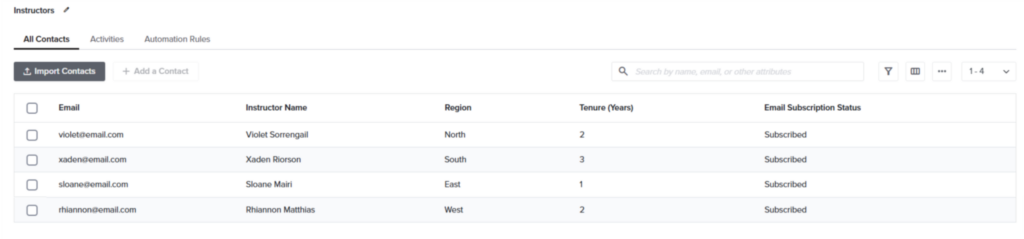
By linking that instructor – the feedback recipient – back to their Directory record, you can filter and segment your survey results based on those Directory Fields. Now, you can pull survey results based on the region or the length of time someone’s been an instructor.
Ready for reporting? Directory fields are now filterable / segmentable fields within Dashboards. [Bonus: These fields can also be used to push data into Mail Merge and Data Population variables within your surveys and survey invitations!]
Drill down on Dashboard dates
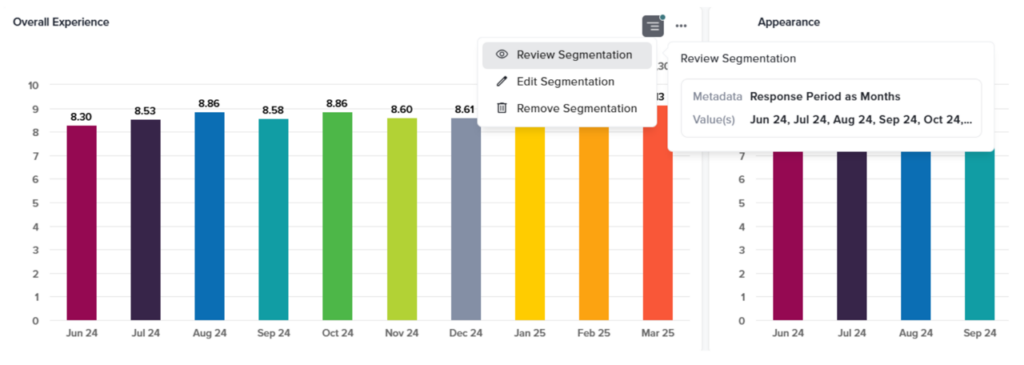
- Ability to apply segmentation to Custom Dashboards based on Monthly, Quarterly, and Yearly periods
We’ve been hearing lots of great feedback about Custom Dashboards, from the ability to arrange reporting widgets into at-a-glance data displays to the opportunity to bring together data sets from different projects together.
A favorite update from this release is the ability to segment data in Custom Dashboard widgets by response period. Now, you can segment results based on the month, quarter, or year in which they were captured. This simplifies your reporting and makes it much easier to review trends.
Can’t get enough segments in your Custom Dashboards? Check out Dashboard-Level Segmentation! This is an awesome tool that allows you to use a single dashboard to share results with different stakeholders based on the segments they should see. Maybe you’d like to create a company-wide Dashboard, then create separate unique data slices for each manager to review their own department’s data. Done!
Want to get fancy? You can now allow report viewers to see multiple segment groups within their Dashboard. For example, you could allow them to see only their own region(s) within the Dashboard, then segment down further to individual employees at each location.
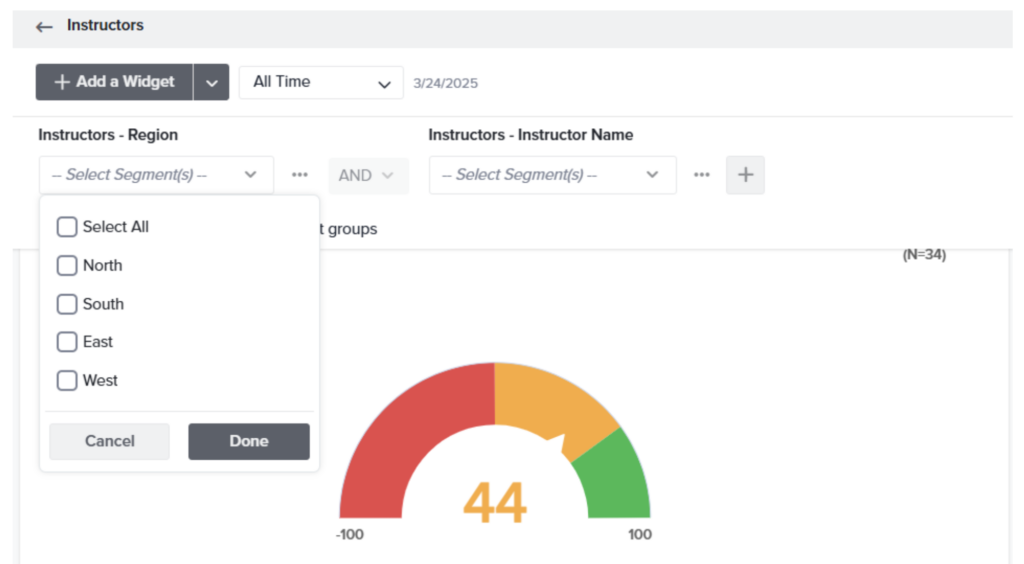
Sharing those segmented reports has become even easier, as you can now assign the segments you want to share via Directories or Contact Lists.
Plus, a few extra enhancements to the already-popular Custom Dashboards: You can now show/hide the total responses in each Widget as well as bulk remove widgets from a Dashboard.
But wait — there’s more, including…
-
- Conditional Rules & Alerts can be triggered based on participant language.
- Sub-questions can be hidden within the grid question-type.
- More sharing options available with CX / EX Dashboards
Stay tuned! 🙂
Want to catch up? Connect with your account manager or book a training call to walk through the latest. Also, remember that options vary by account type, so log in to see for yourself or drop a note to our support team with any questions.