
Results at a Glance
Between 2022-2023 and 2025-2026 parent/guardian perceptions of their school’s safety and security practices rose 14 percentage points from 70% → 84%
Secondary student favorable perceptions rose 12 percentage points from 68% → 80%
Rate of improvement: three to six times the national rate over the same period
Achieved without expensive new security hardware. The change was in how the district used survey data to communicate, explain, and build trust around the practices it already had.
Foxborough Public Schools did not add more cameras, or metal detectors. Its safety practices were already in place and had been for years. What changed was how the district used community feedback to communicate those practices, explain them to families, and build trust around them.
Three years later, favorable perceptions of School Safety and Security among parents/guardians climbed 14 percentage points. Among secondary students, they climbed 12. Nationally, the same measures barely moved.
This is a case study in what happens when a district treats feedback as a starting point for action, not a finish line for data collection.
A Feedback-to-Action Moment
When Foxborough reviewed its annual climate survey results, one pattern stood out. Many respondents were selecting “Don’t Know” on items regarding safety and security procedures and reporting protocols. That response told the district something specific: this was an awareness gap, not a satisfaction gap. The reporting tools existed, and the safety practices and protocols were in place, but the issue was that too few people knew about them.
The district acted. They raised the visibility of the anonymous bullying report on the school website, localized and increased transparency in safety protocols, and developed strategic partnerships to create community and a culture of safety. These targeted communication and community development practices aimed to close the awareness gap. To ensure these actions were aligned with community needs, they monitored the result on the next year’s survey.
The following year’s data reflected their work. They began seeing “Don’t Know” responses decrease, and agreement responses increase.
For example, in 2022–2023, 72% of parents/guardians felt School Resource Officers (SRO) were important, but 24% selected “Don’t Know.” By 2025–2026, 83% said SROs were important, and only 13% selected “Don’t Know.” This growth was made possible by listening to feedback and making intentional efforts to communicate with the community about the purpose of SROs as well as have SROs really integrate themselves into school culture.
This is what turning data into action looks like. No expensive programs. No added cost. A district paying close attention to what the data was actually saying and responding with intent.

The National Picture
Safety has been the weakest dimension of school climate for three consecutive years, according to the Sogolytics’ Annual Benchmark Report on School Climate.
Nationally, parent/guardian favorable perceptions moved from 72% to 76% between 2022–2023 and 2024–2025. Secondary student favorable perceptions moved from 65% to 67% over the same period.
Federal data tells a similar story. The 2023 Youth Risk Behavior Survey documented rising reports of bullying, threats, and students missing school because they felt unsafe (CDC, 2024). The most recent School Survey on Crime and Safety found persistent safety-related disruptions across public schools (Burr, Kemp, & Wang, 2024).
Most districts have responded by investing in visible security. RAND’s 2025 review confirmed that hardware-focused measures remain widespread. Yet research shows visible security alone does not consistently improve, and can sometimes reduce, how safe students feel when it is not paired with trust, communication, and relational infrastructure (Byrd et al., 2025).
Research shows students and staff feel safest when school-based relationships are strong, practices are fair, and communication is clear (Williams et al., 2018). School-wide positive behavioral interventions and integrated mental health supports show measurable impact on safety perceptions as they can help develop protective factors to promote belonging and interconnectedness among the school community (Elrod et al., 2021; CDC, 2024).
Overall, how a district communicates and responds matters just as much, if not more, than what it installs.
By the Numbers: Foxborough vs. the National Benchmark
Foxborough partners with Sogolytics’ Managed Research to conduct and analyze its annual climate survey. That partnership gives the district consistent year-over-year survey data, national benchmark comparisons, and the analytical depth to surface patterns that set the District’s strategy in motion.
Parent/Guardian Perceptions — Safety and Behavior (% Favorable)
| Year | Foxborough | National Benchmark |
|---|---|---|
| 2022–2023 | 70% | 72% |
| 2025–2026 | 84% | 76%* |
| Change | +14 pts | +4 pts |
*National benchmark reflects the most recent available year (2024–2025).
Secondary Student Perceptions — Safety and Behavior (% Favorable)
| Year | Foxborough | National Benchmark |
|---|---|---|
| 2022–2023 | 68% | 65% |
| 2025–2026 | 80% | 67%* |
| Change | +12 pts | +2 pts |
*National benchmark reflects the most recent available year (2024–2025).
Three things stand out.
- Foxborough’s 2022–2023 parent baseline of 70% sat below the national average of 72%. These gains are not the story of an already-high starting point.
- The rate of improvement ran three to six times the national rate, depending on the respondent group.
- Gains show up across stakeholder groups, a signal that the district’s approach is landing consistently.
Item-level results tell the same story. Foxborough addressed six factors of school safety among their District to create a culture of safety.

Foxborough’s Safety Framework
The district’s philosophy is clear: student and staff safety is the top priority, and strong partnerships across schools, families, and community make safety possible. None of the six pillars below are new. The change is in how they work together and how well the community understands them.
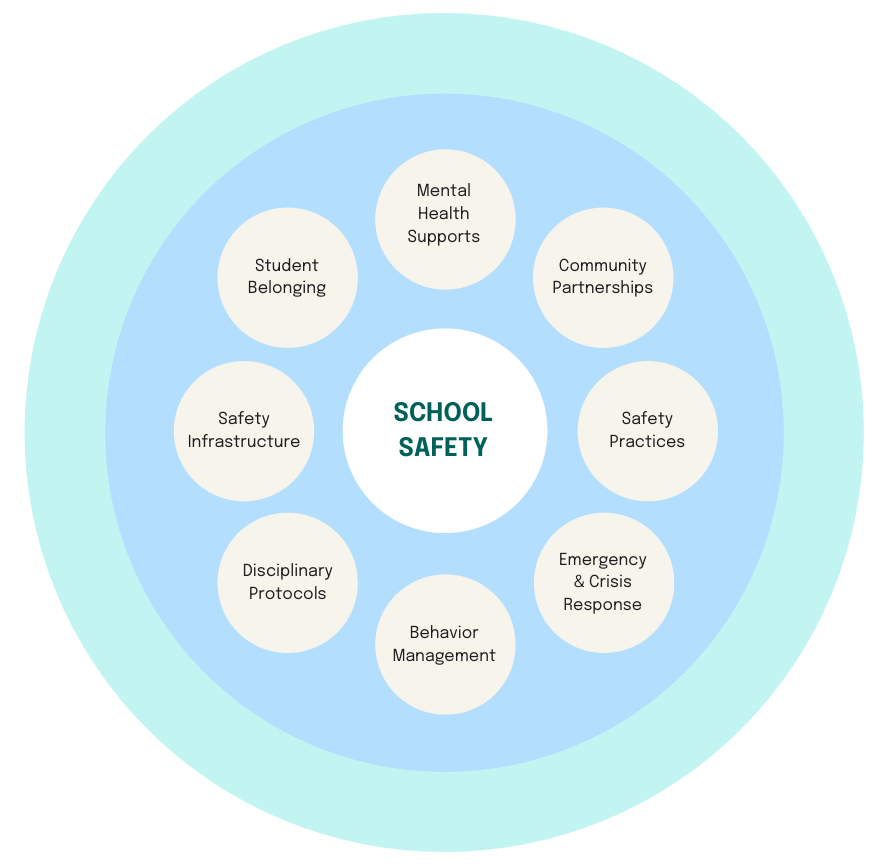
1. Communication and Transparency
If there is one thread running through every dimension of Foxborough’s improvement, it is communication.
The Mass Notification System (SchoolMessenger) delivers real-time alerts during emergencies. A School Safety Parent Letter, co-signed by the Superintendent, Chief of Police, and Fire Chief, goes to every family. A School Safety FAQ, emergency terminology guides, and visitor procedures give families clear reference points year-round.
At the governance level, the School Committee hosts an Annual School Safety Update. That forum delivers public accountability and gives the community a direct line into how the district thinks about safety.
Additionally the District established a Crisis Team, now in its second year, that works on reunification procedures, crisis response, and proactive identification of gaps in safety perceptions or processes.
For example, when survey data revealed the “Don’t Know” pattern on bullying-reporting items, the district responded with targeted communication. Favorable responses climbed. That data-to-action cycle sits at the center of everything else that follows.
2. School Resource Officers
In Foxborough’s SRO program, officers serve a tripartite role: law enforcement, educator, and informal mentor.
What sets the program apart is depth of integration. SROs run classroom lessons. They join grade-level and school-wide meetings. Additionally, the district’s “Protect and Serve” Lunch program has officers sitting down with students during lunch time allowing them to be integrated parts of the school community.
The data reflects it. In 2025–2026, perceptions that SROs are important and necessary increased:
- Parent/Guardian agreement (83%) rose 11 percentage points since 2022-2023
- Student agreement (83%) rose 18 percentage points since 2022-2023
- Staff agreement (89%) rose 21percentage points since 2022-2023
3. Standardized Emergency Response Plan
Foxborough uses the I Love U Guys Foundation’s Standard Response Protocol (SRP), a nationally recognized framework that gives students, staff, and first responders one shared language for emergencies.
The district then localized it. An external partner helped “Foxborough-ify” the SRP with visuals and examples that reflect the district’s own community. Student assemblies carried consistent messaging across every school. Training used concrete, familiar examples. Moreover, a new communication model for lockdown drills told families what drills would look like and provided guidance on how to talk to their children about them, so preparation extended into the home.
The results are visible:
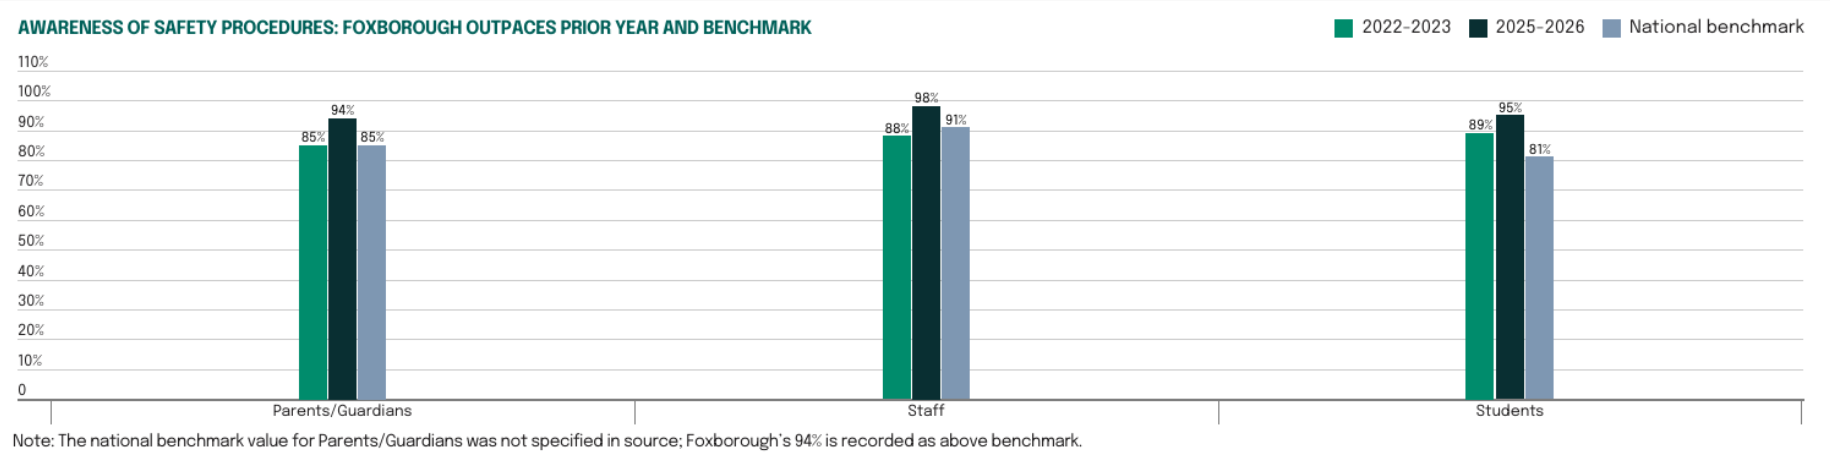
- 94% of parents/guardians say their student is aware of safety procedures (9 points higher than 2022–2023, and above the national benchmark)
- 95% of secondary students say the same (6 points higher, 14 points above benchmark)
- 98% of staff said students are aware (10 points higher, 7 above benchmark)
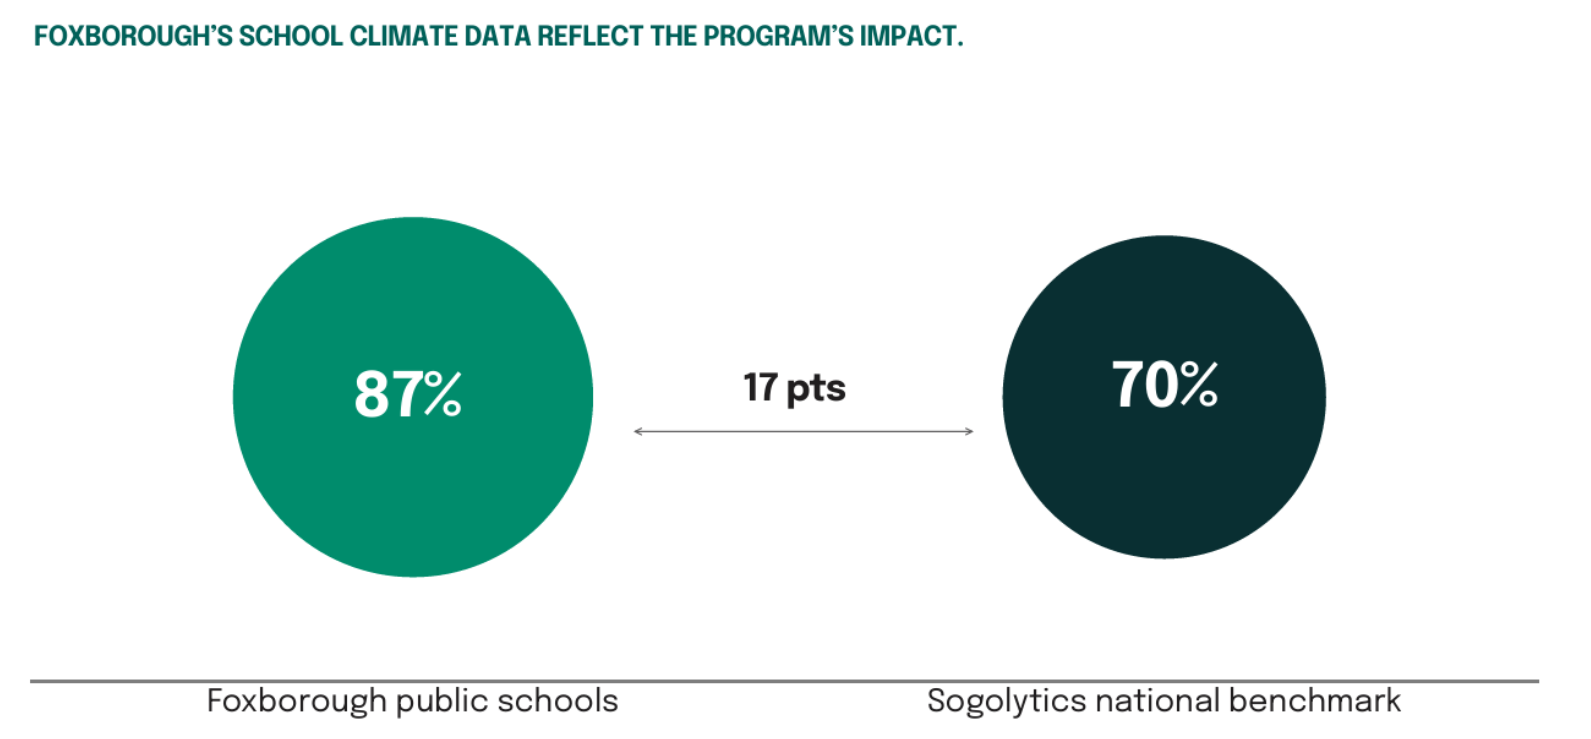
4. Partnership with Local Public Safety
The District created strong partnerships with Foxborough’s Chief of Police that includes weekly joint meetings between school personnel and the Foxborough Public Safety Departments to keep information flowing.
Each school has an emergency plan co-developed with local police and fire departments, presented to the school community by the Chief of Police and drills run throughout the year with all partners present. Moreover, the “See Something, Say Something” strategy and an anonymous tip line extend the safety network beyond school walls.
The result shows up in the data: 87% of Foxborough students feel safe at school, compared to 70% in the national benchmark.
5. Consistent Disciplinary and Behavioral Procedures
Standardized student handbooks, age-appropriate safety education (including elementary Safe Touch Lessons), an Anonymous Bullying Report system, and the “See Something, Say Something” tip line give every member of the school community a low-barrier way to raise concerns and a shared set of expectations for behavior.
Consistency matters. Research shows predictable, fair, and timely behavioral responses produce stronger safety perceptions than intermittent enforcement.
Survey data from 2025–2026 tracks with the research:
- 79% of secondary students say behaviors are addressed (a 9 percentage point increase from 2022-2023)
- 71% of students say bullying and threatening behavior are rare (a 12 percentage point increase from 2022-2023), and compared to 64% nationally
- 74% of students say students treat each other with respect (a 10 percentage point increase from 2023-2024), and compared to 51% nationally
- 76% of students say staff are responsive when students report bullying (a 12 percentage point increase from 2022-2023), and compared to 63% nationally
- 77% of staff say students follow school rules (a 6 percentage point rise from 2022-2023)
- 70% of staff say bullying or threatening behavior is rare (a 3 percentage point rise from 2022-2023)
Gains across students and faculty signal consistency people really experience, not a policy that only lives on paper.
6. Mental Health as a Safety Strategy
Foxborough positions mental health inside the safety framework, not besides it. Each school has a dedicated Mental Health Team that has a long-range goal of building a comprehensive system of prevention, early intervention, and ongoing support for students.
The intervention is preventative. Identify vulnerable students early. Intervene before situations escalate. Address the conditions that can give rise to unsafe behavior.
The belonging data reinforces the approach:
- 89% of students say their school promotes acceptance
- 85% say their school celebrates differences
- 87% say their school promotes an inclusive setting
- 91% say there are many opportunities for extracurricular involvement
National benchmarks for comparable items: 72% feel accepted in their school, 69% participate in extracurriculars.
What Sets Foxborough Apart
Three patterns explain the outsized gains.
The district uses survey data as a catalyst, not a scorecard.
When “Don’t Know” responses signaled a communication gap, Foxborough responded, visibly, quickly, and in a way the community could see. That responsiveness builds trust over time. Trust itself is a safety condition.
The district treats communication as infrastructure, not an afterthought.
Many districts run strong safety practices that their communities never fully see or understand. Foxborough made its existing framework legible to every community member, through local visuals, parent letters, FAQs, public meetings, developmentally appropriate training, and real-time alerts.
The safety model is layered and community-oriented, not reliant on any single mechanism.
Partnerships with SROs and Foxborough’s Chief of Police ensure they are consistent, and visible members of the school community. From lunch programs to safety assemblies to joint messaging, they show up. The research is clear on this point: school safety is produced by systems, not single programs.
How Sogolytics’ Managed Research Supports This Work
Sogolytics’ role is to make the data-to-action cycle practical at scale, so district leaders spend their time acting on what the data says, not administering the research that produces it.
Foxborough partners with Sogolytics through Managed Research, a fully managed research service for organizations that want precision research without the burden of running and analyzing it internally. For Foxborough, Managed Research delivers:
- Expert survey design and question optimization aligned to district goals
- Annual deployment and data collection across parents, students, staff, and faculty using census sampling
- Longitudinal comparison across years, so change is measurable and defensible
- Item-level analysis that surfaces patterns
- Segmentation by respondent group, school and given demographic groups
- National benchmark comparisons that place district results in context
- Board-ready reports designed for leaders who need to know what to do next, not only what to measure
The through-line is simple. Feedback that only lives in a report changes little. Feedback that gets back to the right people, in the right form, at the right moment, changes outcomes. That is the work Managed Research is built for.
Conclusion
Foxborough Public Schools shows that meaningful improvement in how safe a school community feels does not require more expensive hardware or punitive policies. It requires a clear cycle: gather real feedback, read it closely, act on it visibly, and communicate every step.
Safety is a community partnership. Foxborough’s framework, grounded in communication, prevention, and shared responsibility, offers a model any district can adapt. The tools already exist in most districts. The work is in making them visible, trusted, and connected to a feedback loop the community can see.
To get more details on this case study and learn several practical lessons for districts seeking to improve safety perceptions and outcomes please download the full case study with practical implications for school leaders here.
For District Leaders
Sogolytics Managed Research supports school districts running annual climate, safety, and engagement surveys end to end, from design through board-ready reporting. To explore what a partnership could look like for your district, visit sogolytics.com or contact the Sogolytics team directly.
Methodology Note
This case study draws on the Sogolytics’ School Climate Survey (Foxborough Public Schools, 2025–2026), the Sogolytics’ Annual Benchmark Report on School Climate (2024–2025), and safety communications from Foxborough Public Schools. All Foxborough-specific data come from Sogolytics-administered surveys using census sampling methodology, fielded and analyzed through Sogolytics’ Managed Research.
Sources
Burr, R., Kemp, J., & Wang, K. (2024). Crime, violence, discipline, and safety in U.S. public schools: Findings from the School Survey on Crime and Safety: 2021–22 (NCES 2024-043). National Center for Education Statistics. Byrd, K., et al. (2025). Perceived effectiveness and intrusiveness of school security measures among students, parents, and staff. Centers for Disease Control and Prevention. (2024). 2023 Youth Risk Behavior Survey results. Centers for Disease Control and Prevention. (2024). Youth Risk Behavior Surveillance — United States, 2023. MMWR Surveillance Summaries, 73(Suppl 4). Elrod, B. G., Rice, E. H., & Meadan, H. (2021). School climate: Perceptions of safety, belonging, engagement, and school-wide positive behavioral interventions and supports. Journal of Positive Behavior Interventions, 23(4), 213–224. RAND Corporation. (2025). Understanding school safety trends (including physical security measures in K–12 schools, 2024–2025). Sogolytics. (2025). School Climate Survey: Annual Benchmark Report, School Year 2024–2025. Trovato, D., & Zimmerman, A. (2024). Teacher practices, perceived discrimination, and school discipline: Implications for school climate. Educational Researcher, 53(2), 78–91. U.S. Department of Education & U.S. Department of Homeland Security. (2024). K–12 school security guide and enhancing school safety using a threat assessment model. Williams, L. J., et al. (2018). School safety and climate: The role of physical environment, relationships, and health supports. Journal of School Health, 88(7), 488–497.