
Most credit unions know their members well. They know their names and their financial milestones. But knowing members and understanding their experience across every touchpoint are two very different things.
That picture is what a member journey map gives you. It captures every interaction a member has with the credit union, from the first Google search to the auto loan five years later and surfaces the moments where the relationship grows or quietly starts to fray. Every small moment adds to the overall member experience.
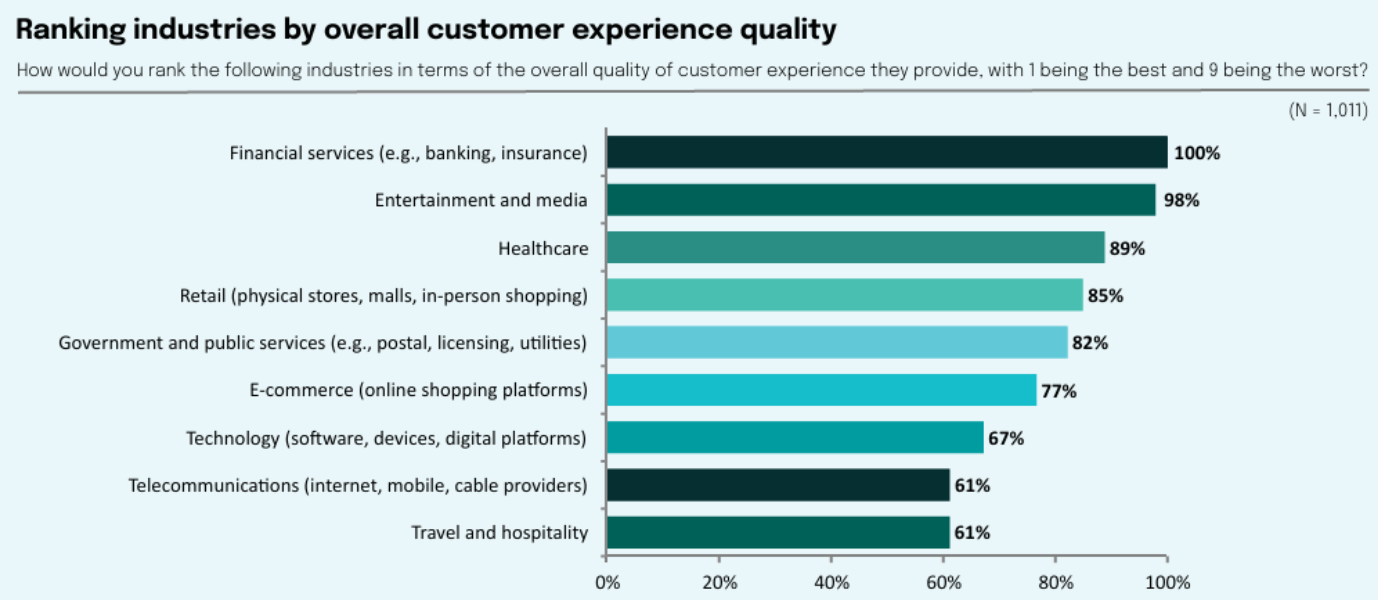
And it’s not that credit unions and financial institutions haven’t made progress on CX. Sogolytics’ Experience Index: Customer Edition (CX) 2026 found that financial services lead all industries on overall CX quality. But the same report shows 33% of consumers are likely to switch to a competitor after a single bad experience. Leading the category does not insulate you from a member walking out over a 20-minute wait or a declined mobile deposit they could not get answers on.
Mapping Starts with Knowing Who You Are Mapping For
Different members have different relationships and requirements with the same credit union. Treating them as one block is the fastest way to build a journey map that helps no one in particular.
A young professional opening their first checking account expects every interaction to happen in an app. They care about how fast they can move money, whether your app works as well as Venmo, and whether anyone explains why they need to come into a branch to verify a wire transfer. They will not stay loyal out of habit. If your digital experience lags behind the apps they already use daily, they will route their primary deposits elsewhere within months.
A retiree on fixed income runs their financial life on trust and predictability. They want to know their statements are accurate, their fraud alerts are real, and that someone will pick up when they call. They notice when the teller they have known for ten years gets replaced. Their journey is shorter on digital touchpoints but heavier on relational ones.
A small business owner treats the credit union as critical infrastructure, not a banking provider. They need a credit line that actually closes in two weeks, a treasury team that returns emails, and a digital experience that lets them run payroll without thinking about it. When something breaks, they expect an answer the same day, not a ticket number.
Each of these members shares the same credit union but lives a different journey through it. A good map tells you where those journeys overlap, where they diverge, and which moments matter most to which group.
What Gets Missed Without a Journey Map
Credit unions often manage experience in silos. Like the branch team owns lobby service, while the digital team owns the mobile app, and the lending team owns the loan workflow. Each team measures its own piece, but no one owns the experience as a whole.
To put this in perspective, consider a member who opens an account in person, downloads the app a week later, and hits a friction point during mobile deposit. They never come back to the branch with the same enthusiasm. The branch sees a happy onboarding score, while the digital team sees an app abandonment metric. But, neither team sees the connection.
Journey mapping forces that connection. It lays out the full path a member takes, identifies where handoffs break, and exposes where service quality drops between channels.
The Six Priority Journeys for Credit Unions
Not every journey deserves equal attention. The credit unions making real progress focus on the six paths that shape long-term member relationships.
1. New member onboarding sets the tone
Account opening, identity verification, welcome communication, and first-week activation all fall here. A confusing onboarding experience signals that future interactions will be harder than they need to be.
2. In-branch service adds the human element
The CX 2026 report found empathy and courtesy from staff (33%) and fast resolution time (33%) as the top drivers of standout experiences. Branches are where credit unions still hold a meaningful edge over big banks. Mapping this journey protects that edge.
3. Digital banking adoption helps boost member lifetime value
Friction in mobile deposits, transfers, or bill pay quietly pushes members toward fintech apps for the things you should be doing for them.
4. Loan applications are where revenue is won or lost
Members who abandon mid-application rarely come back. A clear journey map exposes exactly where drop-off happens and what triggered it.
5. Rates, fees, and terms communication builds trust
When members feel surprised by a fee, or unclear about a rate change, the relationship cracks. Mapping how this information reaches members across statements, in-app notifications, and branch conversations is foundational to retention.
6. Complaints and service recovery decide whether a member stays or leaves
A poorly handled complaint does more damage to retention than the original problem. Members who get a fast, accountable response after something goes wrong often end up more loyal than members who never had an issue at all. Mapping how a complaint flows from the first call or DM through resolution, follow-up, and root-cause fix turns service recovery into a retention engine instead of a fire drill.
The Metrics that Tell You the Map is Working
A journey map without measurement is a diagram. Three metrics do most of the work for credit unions, and each fits a different kind of moment.
| Metric | What It Measures | Relationship Level Checkpoints |
|---|---|---|
| NPS | The likelihood of a member recommending the credit union | Post-onboarding, annual reviews, post mortgage application |
| CES | Effort a member had to put to get something done | Completing a loan application, resolving a dispute, using a new digital feature |
| CSAT | Member satisfaction with a specific interaction | A branch visit, on-call OR in-chat customer support |
None of these on their own gives you a complete read. NPS without CES can hide friction. CSAT without NPS can flatter a transaction that did not move the relationship. Mature programs use all three, attached to the touchpoints they were built for.
How To Build a Credit Union Member Journey Map
The teams that get journey mapping to stick treat it as a structured project, not a workshop output. Here is the six-step process most credit unions can follow without external help.
1. Pick the journey to map first
Do not try to map everything at once. Choose the journey tied to your biggest retention or growth lever, usually onboarding, lending, or digital adoption.
2. Identify the personas who travel that journey
Young professional, retiree, small business owner, established household. Each will experience the same journey differently, and the differences are where the insight lives.
3. Inventory every touchpoint along the path
Walk the journey end to end. Include the website visit before account opening, the email confirmation, the branch visit, the app download, the first transfer, the welcome call. Miss a touchpoint and you miss a friction point.
4. Attach a feedback method to each touchpoint
Decide what you are listening for, when, and how. Post-onboarding NPS survey at day 30. CES survey at the end of every loan application. CSAT pulse after every branch visit. The methods need to match the moment.
5. Connect each touchpoint to an owner and a metric
Without ownership, nothing changes. Without a metric, nothing gets measured. The branch journey belongs to branch operations. The digital journey belongs to the digital team. The loan journey belongs to lending. The map names the team accountable for each segment.
6. Set a review cadence and a fix cadence
Most credit unions review their journey maps quarterly and ship at least one fix per quarter per journey. The map is a living document, not a finished deliverable.
Sogolytics’ Experience Navigator follows roughly the same logic in software. It walks you through industry and vertical, business model, operational scope, and objectives and then suggests the right touchpoints, feedback methods, and metrics for credit unions specifically. The output is a working framework you can put in front of your branch and digital teams the same week.


How Experience Navigator Gets Your Credit Union on the Map
Experience Navigator was built to give credit union leaders a structured way to do this work without starting from a blank page. It maps the digital, physical, process, and human touchpoints that matter most for credit unions, suggests the right feedback method for each moment, and connects the resulting data to the metrics that move retention, lending, and digital adoption.
A real example: First Credit Union, a 5-star Arizona credit union serving 42,000+ members, used journey mapping to rethink how they listened to members.
They had been relying on third-party mystery shoppers, a program that produced just 205 measurements a year and took over a month to report back. The scores rarely matched what members were actually saying, leaving the team measuring the wrong thing, slowly. Switching to Sogolytics’ SogoCX platform they:
- Replaced mystery shoppers with direct member feedback across every touchpoint, captured in real time.
- Reduced reporting delays from six weeks to minutes, so branch teams could act on member responses while the experience was still fresh.
- Made detailed journey maps using high quality real-time data, and the maps surfaced an insight that reshaped operations: members valued relationship-building, friendly service, and personal greetings far more than sales pressure. That single finding redesigned their training and account opening process.
Conclusion
This article covered a lot of ground. Personas, silos, six priority journeys, three core metrics, and a six-step build process all feed into the same outcome. Credit unions that see the full member journey, and not just their slice of it, are the ones converting member experience into deposit growth, lending volume, and lasting loyalty.
Experience Navigator was built to give credit union teams that view without starting from a blank page. It walks leaders through industry, business model, operational scope, and objectives, then surfaces the digital, physical, process, and human touchpoints that matter most for credit unions specifically. For each touchpoint, it recommends the right feedback method and the right metric, so the map arrives with measurement attached. Branch operations, digital, and lending teams can each see their segment of the journey alongside the segments owned by others, which is what turns a journey map from a slide into an operating tool.
While journey mapping is only half the job done, the real value comes from acting on what it reveals, every quarter, across every team that touches the member. That is where most credit unions need a partner, and where Experience Navigator earns its place in the stack.
FAQs About Credit Union Journey Mapping
What is credit union journey mapping?
Credit union journey mapping is the practice of laying out every interaction a member has with the credit union, across digital, branch, phone, and service touchpoints, and using that map to find where the experience breaks down or builds loyalty. It is less of a marketing exercise and more of an operating tool that connects branch, digital, lending, and member service teams around a shared view of the member.
How often should journey maps be updated?
Most credit unions review their maps quarterly and refresh them once a year. New product launches, regulatory changes, major digital releases, and shifts in member behavior all warrant an off-cycle update.
What data is needed for journey mapping?
A solid journey map pulls from four sources: structured feedback (NPS, CES, CSAT surveys tied to specific touchpoints), unstructured feedback (open comments, call transcripts, Google reviews), operational data (application drop-off rates, app session data, branch wait times), and frontline interviews with the staff who handle the journey day to day. The combination is what makes the map honest.
How is journey mapping different from customer satisfaction surveys?
A satisfaction survey tells you how a member felt about one interaction. A journey map tells you how that interaction connects to everything else the member experiences with you, and where the cumulative friction is. CSAT is a snapshot. A journey map is the whole reel.
Which member journeys should credit unions prioritize first?
Most credit unions get the highest return from starting with new member onboarding and the loan application journey. Onboarding sets the tone for every interaction that follows, and the lending journey is where revenue is most directly won or lost. Digital banking adoption and complaint resolution are usually the next two to map.
What are the stages of a credit union member journey?
Most credit union member journeys move through five stages: awareness (a member discovers you through a Google search, a referral, or an employer relationship), consideration (they compare rates, fees, and reviews against banks and other credit unions), onboarding (account opening, identity verification, first deposit, app download), active relationship (everyday banking, lending events, life-stage milestones), and advocacy or attrition (the member either refers others or quietly moves their primary relationship elsewhere). Each stage has its own touchpoints and its own failure modes, which is why mapping is more useful than measuring satisfaction alone.
How does journey mapping improve member retention?
Journey mapping improves retention by surfacing the friction members rarely complain about but always remember. Most members do not leave because of one dramatic failure. They leave because three or four small moments stacked up, an unclear fee, a slow loan approval, an app glitch, an unanswered call. A journey map connects those moments across teams so leaders can see the compounding effect and fix the root cause, not just the symptom. Credit unions that build a quarterly fix cadence around their map tend to see measurable retention gains within two to three quarters.
What tools do credit unions use for member journey mapping?
Credit unions typically use a combination of experience management platforms (such as Sogolytics SogoCX and Experience Navigator), survey and feedback tools tied to specific touchpoints, analytics platforms that track digital and branch behavior, and CRM systems that hold the relationship history. The platform matters less than the integration. A map only works when feedback, behavioral data, and operational data sit in the same view. Experience Navigator was built specifically to give credit union teams that view without months of internal setup.
How is a credit union member journey different from a bank customer journey?
The mechanics overlap, but the expectations do not. Members own their credit union, which raises the bar on transparency, fairness, and personal service. They expect to be recognized, not processed. A bank customer journey can succeed on speed and self-service alone. A credit union member journey has to deliver that same digital convenience and the relational quality that brought members in the door, especially during onboarding, lending, and service recovery. Journey maps for credit unions weight human touchpoints more heavily for that reason.
What metrics should credit unions track in their member journey?
Three core experience metrics do most of the work: NPS for relationship-level health, CES for transactional effort, and CSAT for touchpoint-level satisfaction. These are most useful when paired with operational metrics that show whether the experience is changing behavior, like application completion rate, digital adoption rate, branch wait time, complaint resolution time, and member retention rate by tenure. The combination of experience metrics and operational metrics is what turns a journey map from a diagram into a management tool.