Every airline CX team carries the same quiet worry: the delay that cascades into a dozen missed connections, the cancellation that strands a full cabin, the trip that flips from routine to complaint in a single announcement. Disruptions get treated as pure downside, something to contain, apologize for, and move past.
The Sogolytics CX Rankings: U.S. Airlines 2026, drawn from 1,014 travelers across the six largest U.S. carriers, tells a more useful story. Disruption is not only a cost to manage. It is the single moment where loyalty moves most, in either direction. Handle it well and travelers come back more committed than before. Handle it poorly and you hand the customer to a competitor.
For any team measuring experience, that shifts where the real work sits. The trip that goes smoothly rarely decides anything. The trip that goes sideways decides almost everything that follows.
Price Gets the First Booking. Experience Wins Relationships.
Half of travelers (50%) name ticket price as the most important factor when choosing an airline, twice the share of the next-highest driver. That single number anchors most pricing and acquisition decisions. The loyalty data points somewhere else entirely.
The two cheapest carriers in the study land at opposite ends of every loyalty measure. Allegiant sits near the top with an NPS of +32 and 89% of travelers likely to fly again. Frontier ranks last, the only carrier with a negative NPS at -6 and 75% likely to return. Same low-fare promise, opposite outcomes. If fare drove loyalty, the two would move together.
The report puts it plainly: price wins the booking, and experience wins the next one. Within that experience, one stage carries far more weight than the rest.
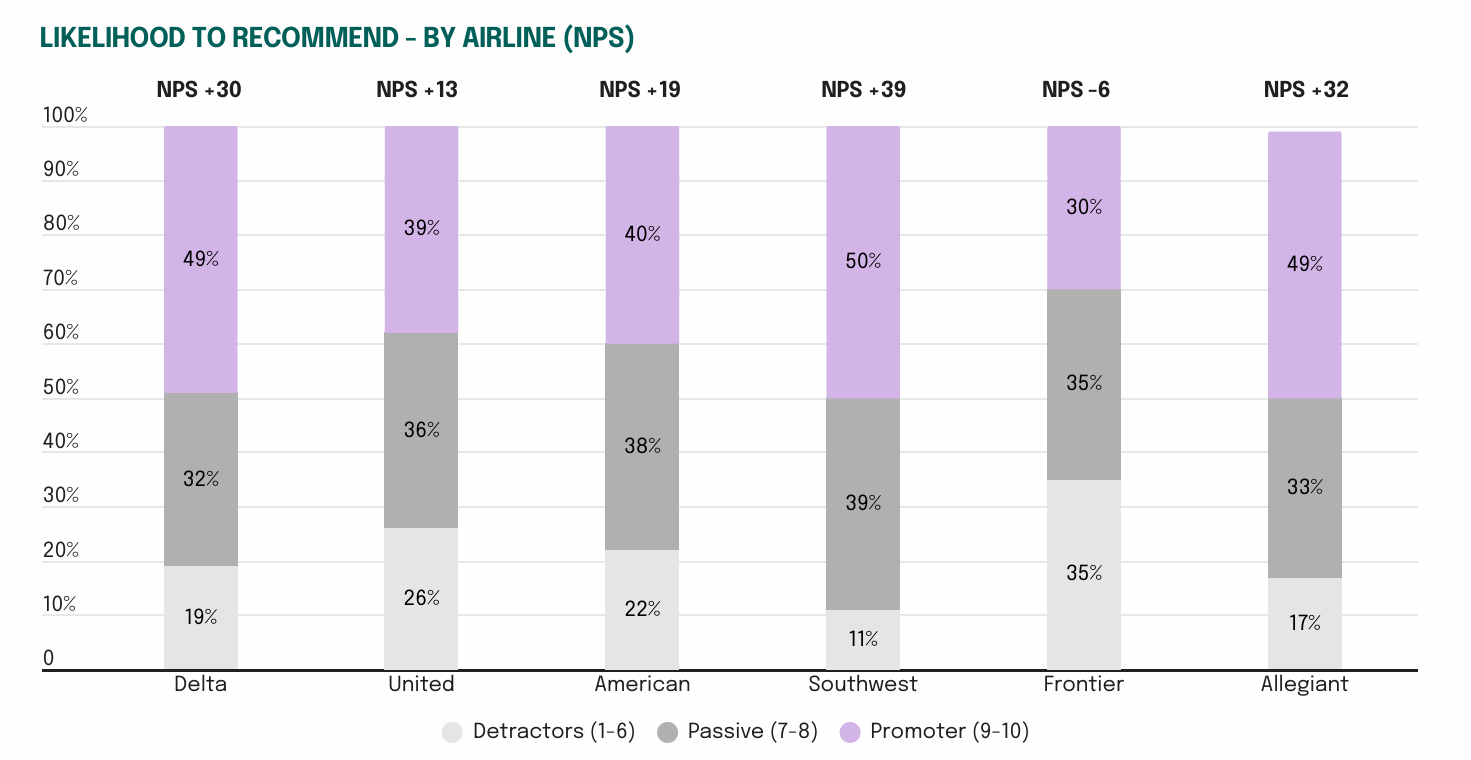
Figure 1, Sogolytics CX Rankings: U.S. Airlines 2026. Likelihood to recommend, by airline (NPS).
Disruption is a Third of the Journey, not an Edge Case
Disruptions are common enough that no CX strategy can treat them as rare. Nearly a third of travelers (32%) reported a delay of 30 minutes or more, a cancellation, or a missed connection on their most recent flight.
The rate varies sharply by carrier. United’s disrupted share reached 43%, the highest in the study, followed by American at 40%. Allegiant saw the lowest at 19%. A traveler on a large legacy carrier was more than twice as likely to hit a disruption as one flying Allegiant.
That spread matters because disruption is not a fixed cost that spans evenly across the market. It is a recurring test that a large share of customers will face at some point. The question is never whether it happens. It is what happens next.
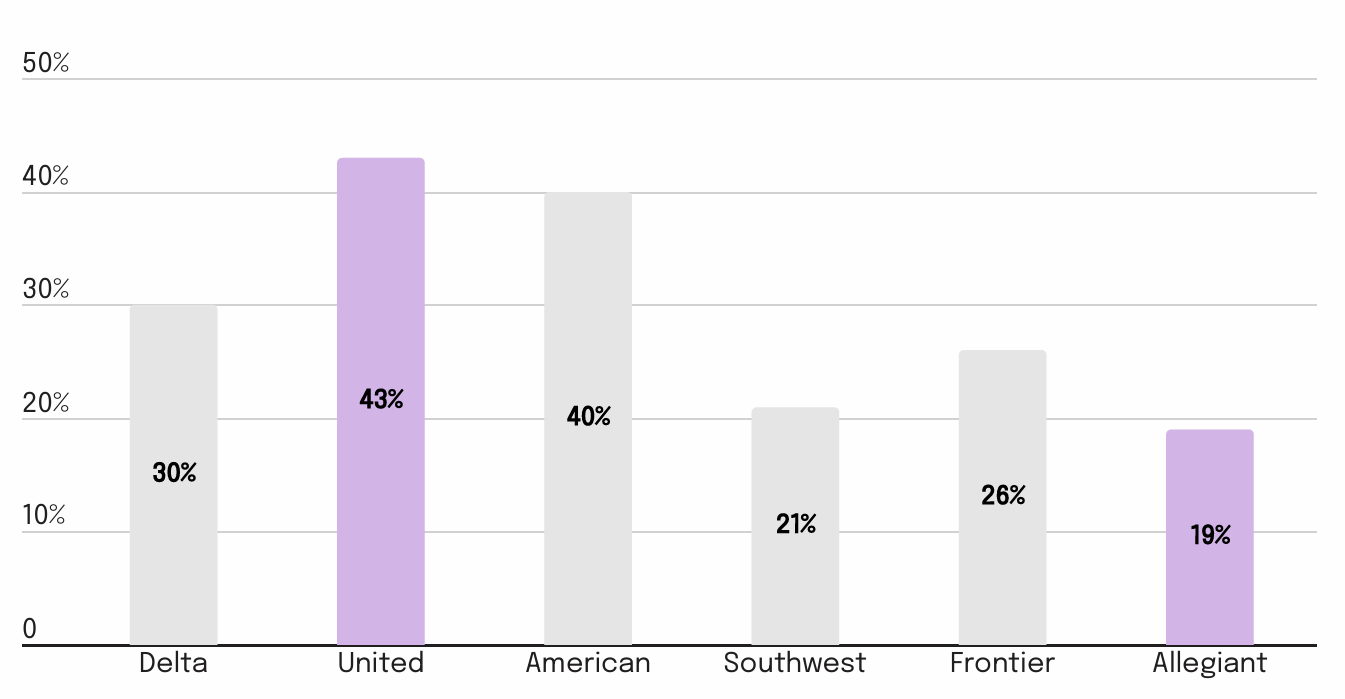
Figure 2, Sogolytics CX Rankings: U.S. Airlines 2026. Share of travelers reporting a disruption on their most recent flight.
The Moment that Moves Loyalty Most
Here is the finding that should reshape where CX teams spend their attention. Among travelers who experienced a disruption, 38% said they were more likely to fly the airline again after it was handled well, against 20% who became less likely. That is a net loyalty gain of 18 points, earned in the middle of the worst part of the trip.
The carriers that recover well from bad CX are the ones that pull away from the pack. For instance, according to the report findings, Delta and American convert disruption into loyalty most often, with 42% of their disrupted travelers coming away more likely to return. Frontier converts least, at 30%. The gap is not about who avoids disruption. It is about who turns it around once it lands.
Satisfaction with disruption handling follows the same line. Delta led at 68% of affected travelers satisfied with the response, with United, American, and Southwest clustered in the mid-60s. Frontier trailed at 42%, though its disrupted sample was small (n=27) and should be read with that limit in mind.
The pattern holds across the full dataset. The airlines that recover well are the same ones that lead on overall satisfaction, NPS, and repeat business. Recovery is not damage control bolted onto the end of a bad day. It is the highest-leverage customer experience moment an airline has.
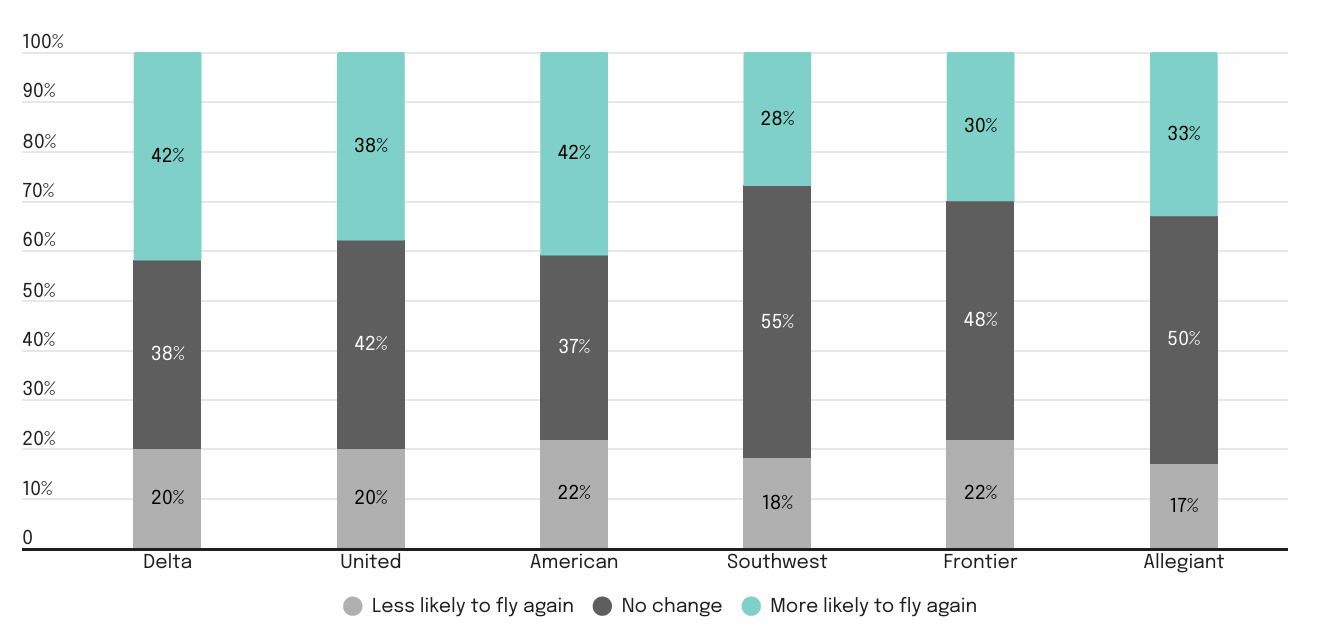
Figure 3, Sogolytics CX Rankings: U.S. Airlines 2026. Loyalty impact of disruption handling, by airline.


Why Most Teams Miss it
Given how much recovery is worth, it is striking that most CX investment still lands elsewhere, and part of the reason comes down to measurement. Most programs track a single overall satisfaction score alongside a headline NPS, and while both metrics are useful, both also flatten the journey into a number that hides the exact moment where loyalty is decided.
A composite satisfaction figure averages those two very different experiences into a single number that points nowhere useful, since it cannot tell a team whether they are losing travelers at the gate or in the seat, and it reveals nothing about how they perform in the recovery moments that carry the most weight. To act on any of it, you have to measure the journey in its parts rather than as one lump sum.
This mirrors the treatment on the previous section: longer connected sentences, the short declarative lines folded in, and the emphasis landing at the end of each paragraph.
Illustrative Scenario: A Mid-sized Regional Carrier
Picture a regional carrier with a healthy composite satisfaction score, say 85%, and a leadership team confident the experience is in good shape. Underneath that headline, booking and boarding rate well, while disruption handling sits far lower. Because the top-line number looks fine, no one flags the gap, and churn among disrupted travelers keep climbing without an obvious cause.
Break the score into stages and the picture changes. The same team can now see that a small slice of trips, the disrupted ones, is doing most of the damage to loyalty. That is a fixable problem with a clear owner: faster rebooking, clearer communication, and better options at the moment of failure. The composite score alone never would have surfaced it.
From Blind Spot to Advantage
The carriers already treating recovery as a measurable, ownable moment are pulling ahead on exactly the metrics that predict repeat business. That is the competitive line forming in the data, and it widens with every quarter a team leaves the recovery moment unmeasured.
This is where a diagnostic approach earns its place. Experience Navigator is built to map satisfaction across each stage of the journey rather than collapsing it into one figure, so teams can see where loyalty is won and lost across pre-trip, in-airport, in-flight, and recovery. It does not fix the experience on its own. It shows precisely where the experience is breaking and how much that break is costing, which is the starting point for any team serious about turning disruption into loyalty.
Price will keep winning the first booking. It always has. But the airline that earns the second, third, and tenth is the one that shows up when the trip goes wrong. Recovery is not the exception to customer experience. For nearly a third of travelers, it is the experience. The teams that measure it that way are the ones that will own the loyalty that follows.
Ticket price is the top factor travelers cite when choosing an airline (50%), but the 2026 Sogolytics rankings show loyalty is driven more by experience than fare. Recovery from disruptions moved future loyalty most, producing a net gain of 18 points among travelers whose disruption was handled well.
In the Sogolytics study, 32% of travelers reported a delay of 30 minutes or more, a cancellation, or a missed connection on their most recent flight. Disruption rates ranged from 43% at United to 19% at Allegiant.
Yes. Among disrupted travelers, 38% said they were more likely to fly the airline again after a well-handled disruption, compared with 20% who became less likely. Delta and American converted disruption into loyalty most often, at 42%.
A blended score averages very different stages of the journey. The report found airlines perform differently at the airport than in the cabin, and one composite figure hides which stage, including recovery, is driving churn. Measuring satisfaction by stage reveals where loyalty is actually won or lost.
Southwest was the only carrier strong across both the airport and the cabin, and it led every loyalty measure in the study, including the highest NPS at +39 and the highest likelihood to fly again at 91%.
A journey-based diagnostic such as Experience Navigator maps satisfaction across each stage, from pre-trip and in-airport to in-flight and recovery, instead of a single number. That helps teams pinpoint where the experience breaks and how much it costs in lost loyalty.