School climate is the full environment that staff, parents, and students experience and shape every day. It affects how safe and welcome people feel at school and how much families trust it, and knowing where it stands helps staff and leaders shape it with intent.
It’s also easy to misread from the inside. Kate Popham has heard school staff say “My door’s always open” many times, yet when she asked students why they still didn’t come in, they told her that leaving class meant explaining to everyone where they were going.
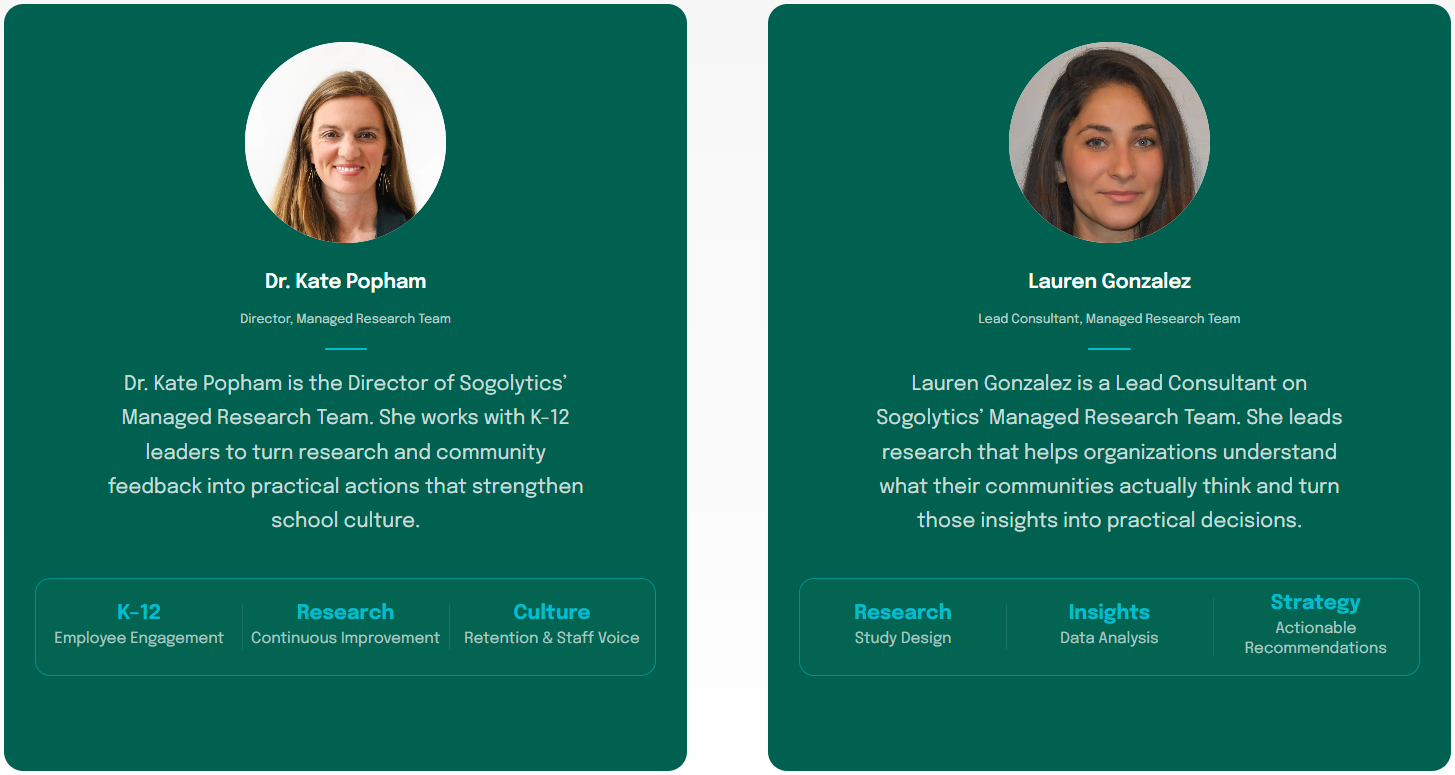
In the first episode of our School Climate series, Kate and Lauren Gonzalez of the Sogolytics Managed Research Team look at what the 2025-2026 State of School Climate benchmark means for teachers and staff starting the school year. In one example, 97% of staff said students have an adult to talk to about a personal problem, while 68% of students agreed.
They also share practical ways leaders can start listening to students, staff, and families this month, with or without a full survey.
Here’s the complete transcript of the webinar.
Note: AI tried its best, but it’s not foolproof. Expect a few errors; that’s the honest truth🙂.
Kate Popham
Welcome to our yearlong series on Setting the Climate. Today, your year of growth begins. My name is Dr. Kate Popham. I’m the director of Managed Research Services at Sogolytics. I’ve been working within the K-12 school space and research for, Lauren and I were just talking about it, I think like 20 years now, which is kind of wild.
I’m going to share a little bit about that, and Lauren is going to do the same, so that we can share with you a little bit of our experience and why we’re so excited to be delivering this professional development series to you today. I started as a high school agriculture teacher, and then went on to be a pre-service teacher educator at the University of Arkansas.
I did that for 10 years, where I did a lot of research on how to collect data on students to improve their school experience. After that, I’ve been working with Sogolytics for the last five years, and I’ve been really excited about the data that we have been able to collect and work with teachers on.
Personally, I’ve got three children that run the full continuum of the educational spectrum. I have a 14-year-old who is a freshman in high school and in gifted and talented. I have an 11-year-old in sixth grade who is more socially inclined than she is academically inclined, and so we spend a lot of time helping her not fall through the cracks.
And then lastly, I have a preschooler who’s in the public preschool program in special education. So both personally and professionally, my education and experience run the full gamut of the K-12 space. Lauren, how about you?
Lauren Gonzalez
Thank you, Kate. My name is Lauren Gonzalez, and I’m the lead research consultant with the Managed Research Team.
I’ve also been here about five years now. But prior to working at Sogolytics, I’ve been in the mixed methods research space, working as a researcher for about 15 years now, which is pretty crazy to think about as well. Ten of those years were specifically geared towards education research.
My education journey really started when I served as an English teacher abroad, and in the US at refugee resettlement centers, where I was serving as an ESL teacher. After working as an ESL teacher, I knew I wanted to stay in the education space, but my classroom management skills were not cut out for the classroom every day.
I started working at Rutgers School of Public Health, where I was working with the New Jersey Safe Schools program, helping to develop teacher education trainings and doing research on teacher education trainings on school safety and how to support students in career and technical education.
So, helping them prepare for life outside of school. I also worked on other aspects of school safety, such as gun violence prevention and how to keep schools safe in that capacity. After that, I went to Teachers College, where I was looking at supporting newcomer students and multilingual students.
From there, I worked with Oxfam to do research with teacher trainings abroad, as well as within the US, looking at how to support newcomer students. And I did some work with the Department of Homeland Security as well to bolster school resilience and student engagement opportunities. So while I don’t have any students in the K-12 system right now, my breadth of research within the US and abroad has given me a lot of context on different educational settings and how to support schools, teachers, and students.
Kate Popham
Awesome. Thanks, Lauren. We’re going to give a little bit of theory as to why we’re so passionate about sharing school climate in a yearlong professional development series. It really shouldn’t take a year to get folks up to speed on what school climate is. Lauren, you’re going to talk about it in, what, two slides?
So let’s talk about why it’s important to have so much professional development on school climate. This is Dunkin and Biddle’s model of the theory of classroom teaching. You’ll see here you’ve got presage variables, and these are things the teachers are bringing into the classroom. It’s their former experiences, the education that they have, their own upbringing and beliefs, and the experiences that they’re having outside of school. They’re bringing those experiences and that education with them as a sort of backlog, and that shapes how they’re interacting in the classroom and in their schools.
Context variables are those same aspects that students are bringing in. They’ve got their own experiences from previous school years. They’ve got experiences and beliefs that they’re getting from their parents and their home lives, and then they’re again bringing those into the classroom.
And see that middle box that says process variables? These are where the teacher’s behaviors and the student’s behaviors are all mixing together and influencing one another. As the teacher is communicating with the student, they’re bringing all their background into that communication. The student is doing the same thing, and their further behaviors and communications are being shaped by the ongoing communication and behavior that they’re seeing from one another as well.
So everyone’s bringing in these background experiences. They enter the school space, and then all of those background experiences are melded with the ongoing experiences that they’re having with one another, so it further shapes that classroom behavior and communication. This is why school climate is so important. Everyone is bringing in their own aspects and background, and they are then utilizing those to shape the behaviors that they’re putting out there in schools.
Those behaviors shape school climate, and as you’re interacting with folks, you’re in turn also further shaping that school climate for the future. This is really the goal of this professional development series. We’re going to help you walk through every dimension of school climate and learn how to take what you can know about school climate today, what’s going on in classrooms today, and shape your behavior and your communication so that you’re positively influencing school climate with intention when you’re actually in the classroom and the school, within those process variables. So now that we’ve gone over why it’s so important to have this much professional development about it, Lauren, tell us what school climate actually is.
Lauren Gonzalez
As you very technically and theoretically described, it’s really not one experience. It’s not one program. It’s not one policy. It’s really what your community is experiencing and being influenced by in those different capacities every day.
It’s what that ninth grader feels when they’re walking into their fourth period class, or what that bus driver feels at the end of their bus route, or what parents feel when they need to call the front office or talk to someone at the district about what’s happening with their students.
Those are the experiences that really put climate into perspective, along with all of the things that are contributing to it, like the quality of instruction and the safety and inclusivity of the environment. Do students feel mentally, emotionally, and physically safe within their community?
So while there is no single component that leads to a strong school climate, it’s really the sum of all these different pieces, which is why it can’t be fixed with one initiative. And why does it matter? It’s really what makes your school community excited to be there and engaged in your district.
We know that positive school climates are associated with strong student achievement, higher engagement, and positive behavior, so it’s going to support student wellbeing. We know that it’s associated with higher graduation rates, and when your school has a positive climate, you’re going to be able to retain and support educator satisfaction.
Moreover, it also builds trust among your families and helps strengthen a school over time. We recently conducted a survey among US families and found that among families who decided to send their child to a different school for the upcoming year, 37% indicated that it was due to a poor school climate.
This was the second most frequently mentioned item after the 24% who left because of a specific incident. So they’re not necessarily being pushed out because they’re moving, or really even because of academics. It’s not academically driven. It’s really about specific incidents and how the district is able to recover from them, as well as those feelings of a poor school climate.
Kate Popham
That’s one of the big kickers with school climate as well, I think: trust. As new things come into the district, like COVID, for example, which came in and threw everyone off, if your district already has a positive school climate when encountering things that are unknown or unprecedented, you’ve already built that trust with families, so that they can say, “I’m not really sure what’s going on here, but I do trust what they’re doing.”
So you’ve got a little bit of leeway there, and you’re not constantly on the defensive.
We’re going to talk a little bit about this gap, and this is really why ongoing professional development in school climate is so critical. What we want to focus on as we consider our own school climates within our buildings is where there’s a gap between the experience that we intend to put out for students and the one that folks are experiencing.
When parents come into the front office, are they getting the experience that you’re intending for them to get? Same with students walking through the hallways. Same with staff coming in every day. You’re trying to identify where those gaps are, and then inserting yourself and adjusting behavior so that you can be a positive influence on that aspect of school climate.
Our most recent 2025-2026 State of School Climate Benchmark Report had a couple of these gaps that we wanted to point out to you. First, in asking whether there was a trusted adult for a personal problem in school, 97% of staff said, “Yes, there is a trusted adult to whom students can go for help with a personal problem.”
When you ask the students, it’s 68%. Now, the folks that really matter there are the students, right? They’ve got to feel like there is an adult that they can go to, whether or not the staff feel that those adults are there. Another one is whether leaders decide in students’ best interests, so that the decisions they’re making are in the best interest of students.
90% of staff agree. 65% of students agreed. Lastly, another one to share is whether or not teachers deliver lessons that are connected to life outside of school. 85% of staff agreed, and 56% of students agreed. Can you imagine if we didn’t highlight that gap, how many teachers would not do anything differently because they think that they’re doing this well?
Not that they don’t care. They literally think that they’re doing this well. And then when you ask the students, that’s where they may be missing the mark. I shared these three examples, but this pattern holds true across nearly every dimension that Lauren’s going to mention here in a minute.
Staff rate every aspect higher than families, and those families rate that aspect higher than their students.
Lauren Gonzalez
First, I want to go through the eight dimensions of school climate. When we conduct our school climate surveys, these are the capacities that we’re measuring and what we’re asking our communities about.
First, looking at teaching and learning, we’re really trying to gauge perceptions of the learning environment and the consistency of the learning expectations that students have. Looking at student support and relationships, what’s offered to students to ensure that they’re academically and emotionally supported in school?
Similarly with social-emotional development, what structures of belonging and engagement are in place to ensure that students feel welcome? Looking at school leadership, simple as that, what are your perceptions of school leadership and communication? Safety and security looks at what your community thinks about safety and emergency preparedness.
Student behavior covers perceptions around student discipline and relationships. Then there’s family involvement, and interactions with teachers and staff. We’ll have a working session on each of those dimensions this year, so no need to absorb it all now, as we’ll be doing a deep dive.
Kate Popham
I’m excited to hear about your previous experience on that safety and security one in particular.
Lauren Gonzalez
We’ve also been working with some school districts on bolstering their safety programs, so I’m excited to talk about that and dive a little bit deeper into those.
So, diving a little bit deeper into the priority areas that Kate was talking about, and really thinking about some of the actions that districts are putting in place to move the needle: to close the adult and student perception gap, we really recommend hearing from students directly.
Sometimes we see districts trying to combine and average student, staff, and parent scores, and by doing that, you’re really missing a lot of that key information and those perception gaps. So it’s really important to look at those separately, and when you see the need, dive deeper and do a bit more exploration with that data to see why students might be responding that way. Another item that we see some districts grappling with is that students have lower perceptions of how relevant their instruction is to the real world.
To combat this, we’ve seen many districts make real-world relevance an instructional standard. This could be asking students what would make lessons feel more relevant, rather than guessing, and hearing directly from them on what they want to learn. We’ve seen some districts invest in PD for teachers geared at instructional strategies to close that gap, as well as integrating more project-based learning.
So it’s really about that kind of grassroots effort, and knowing what will work best with your school community and what your school’s most prepared for.
Kate Popham
One of my favorite aspects of this particular item: I’ve seen this one be the lowest-ranking indicator across the board with nearly every district I work with. When they disaggregate that data further and pull out the responses of career and technical education students from non-CTE students, there is a huge difference there. Those CTE students in particular have much higher perceptions of this item.
It’s not incredibly often that our CTE teachers are utilized as an expert resource, and this is one aspect that is consistently ranked low, with the exception of CTE students. It’s a great opportunity to use those career and tech ed folks as experts in this particular aspect, and to have them lead some professional development on this.
Lauren Gonzalez
Kate, that’s a really great point. We were doing some PD focus groups for a district a couple of years back, and having teacher-led, homegrown PD sessions, where you have experts at the school teaching those sessions, is something that the community really wanted.
There’s always value in having outside experts, but when it comes to the practices that are working well for your students, they want to hear from other teachers in the school who are doing it well. So I think that’s a really great point.
Kate Popham
And that boosts their career opportunities as well, so you’re simultaneously boosting employee engagement. It’s a win, win, win.
Lauren Gonzalez
Third, looking at building proactive and accessible supports for students. One example of this is student-staff relationship mapping, where you assign a trusted adult to a student to help build and bridge those relationships, rather than assuming they form on their own.
I don’t know if you’ve heard of the holiday May Day, the 1st of May. You give flowers, and it’s the start of spring and something very beautiful. Growing up, it was really what helped bridge student-staff relationships. We were paired with a staff member and had a little May Day celebration with that staff member, and it was such a beautiful way of forming that bond in a very natural way. It didn’t feel like, “Okay, this is your teacher who you’re going to be paired with,” or, “This is your staff member who you’re going to be paired with, and this is who you can go to.”
It was like, you have something to bond over and a really beautiful celebration. Whenever I think of that, those really genuine ways to build that connection always ring true for me.
Kate Popham
I love that. We did not have that, and it sounds phenomenal.
What an authentic way to build that accessible support. I did some focus groups with a couple of districts about a year ago, and the gap in this aspect came from staff members saying, “My door’s always open. I don’t know why they just don’t come.” And the students were saying, “I’ve got to tell everybody in the class why I’m going when I need to get a hall pass to go somewhere. There’s no way I’m doing that, and getting up in front of everybody, and leaving the room, and having them all talk about why I left.”
So staff members were completely blind to this, but for students, it was a very legitimate social barrier that kept them from going through all those open doors.
Lauren Gonzalez
Absolutely. I think it’s really about building that familiarity. You might have those structures, or a place where you’re holding space for those opportunities for engagement, but what’s really facilitating them? What’s going to bridge that, I don’t want to say awkward gap, but where’s that mixer happening that’s getting everyone acquainted?
And then last, looking at moving family engagement from access to influence. This is a big thing that I’m seeing as well, where families may feel informed. The communication leaders at our schools are superheroes. They’re sending out newsletters every week, and all the emails and communications are on lock.
But I think where there is a gap is that parents want to give input. They want to feel like they have a stake or have influence in their school district, or want to know how decisions are made. Or maybe you do have surveys, or there are opportunities for giving input, but parents aren’t seeing how input is leading to action.
Over time, if that gap isn’t being filled, it’s going to decrease trust. It’s going to decrease parent involvement in the future. And you won’t really know if you’re getting the right feedback. So I think having an opportunity to close that feedback loop, providing families with opportunities to give real input, and reporting back on how that input is used is really what moves the favorability on those items.
We did go over this data, but I just want to show what this looks like in our reporting. This is an example of our benchmark school climate report. These are the same reports that we give to our clients who conduct surveys with us, and this is what our overall reports look like, as well as our school site reports.
Each school site will receive a report that looks similar to this as well. One thing I really love about these reports is our ability to compare results among participant groups, as you’ll see here. In the next slide, we’ll also see how you can trend that across years. Here you can see those differences from 2025-2026 back to 2023-2024.
So you’re really seeing how those trends change over time. If we can go back to the slide before, sorry, Kate. Here you can really see what that perception gap might look like, and how those perceptions change among the different participant groups. Next, looking at the teaching and learning capacity, that fifth item all the way at the bottom: teachers successfully show how lessons relate to life outside of school.
When you compare it to the other teaching and learning items, it is a bit less favorable, with slower growth. So it shows what’s working well in teaching and learning and what might need a little bit more improvement.
Similarly here, we have, “There’s at least one adult at the school I can go to if I need help with schoolwork, classes, or an academic problem.” Those academic supports are there for students. But “There’s at least one adult at the school I can talk to if I’m dealing with a personal problem or feeling upset” is quite a bit lower. So it’s about helping students know that there’s someone they can go to with a personal problem as well as an academic one.
And lastly, here are the items relating to communication and input. As you can see, all the communication items are quite strong: creating a welcoming environment, staff and families treating each other with respect, promoting opportunities to volunteer, and communicating about events and opportunities for students. But when we talk about input, and the feedback loop around how input is used to improve the school experience and environment, that’s where we’re seeing lower favorability.
Kate Popham
Now, Lauren, what’s your threshold when you’re looking at these and talking with districts? What’s your threshold for an impressive change versus slight differences between one year and the next?
Lauren Gonzalez
Whenever I see something, I always like to look at the three-year comparison over time, because when you see a one or 2% change, that could be margin of error.
It might just be a skew in the participants who took the survey that year, or different participation rates. But if we’re seeing a gradual trend over time and across three years, that, for me, warrants a bit more attention. So I look at multi-year trends, as well as whether you’re seeing a jump above maybe 5%, where it’s like, “Okay, let’s take a look at this.”
One thing I always think about is triangulating that data with other sources of input or feedback that you might be getting. What is this survey saying, and how does that relate to what you might have been hearing in testimonies from parents or emails you’ve been getting? That way you don’t have one source of knowledge that you’re treating as higher than others, and you can see the full story that’s being told.
Kate Popham
Awesome. And in particular on the benchmark, I noticed that three-point jump over time. If I saw a three-point jump in one year, I’d be like, “Could be white noise. We’ll see what it does next year.” But to see that happen twice, year over year, I think indicates we’re on a bit of a trend.
So I’m excited to see that one next year. Lauren and I also run a podcast together called Feedback on the Mic. We’re going to be talking later about predictions of what we expect to see in the data this year, and that was one that I was going to talk about. It’s one of my predictions.
So let’s talk about what you can do with this, right? The whole idea of professional development, versus just a webinar where we’re sharing things, is that you can actually do something today and really see how you can start moving the needle. We always, of course, recommend a climate survey.
That’s what Lauren and I do every day: help school districts develop their school climate surveys, collect that data, and then, as Lauren started doing today with you all, interpret that data to see how things can be improved in future years. So obviously, we recommend a full climate survey that reaches every voice, and that you can benchmark against peer districts and year over year.
Again, that’s what we do. If you want that full picture, please let us know. We are happy to help, and we have folks that do all sorts of varieties of those. But if you aren’t interested in that, or if you’re thinking, “I think I’d like to do that, but let me start somewhere different. I want to actually be able to start today,” there are all kinds of ways that you can start hearing your community without having to jump into a full survey.
First, I love when folks do student listening sessions, or a standing advisory panel, where students feel that their voice is valued and are willing, in a group, to share a little more openly and freely. Next, short empathy interviews. Quick one-on-ones: “Hey, how’s it going? I’ve noticed this particular aspect. How do you all feel about it?”
Exit tickets, or a single pulse question on a card or form. I used to ask students, “Hold up your hands, five, four, three, two, one,” five being really agree and one being really disagree, and ask them just a quick question. Ask staff and students the same question, and then compare their answers and see where there might be that gap.
Walk through your building and read it the way a student would. Walk through the hallway during class changes. This is embarrassing, but it really gets at the work that we do and why this aspect is so important. I was in the school pickup line, waiting in it for about forty-five minutes, and I called the school principal and asked her to drive through as a parent one day, so that she could get the experience of what the pickup line is like for parents coming through and see how that shapes their school climate.
A suggestion channel, paired with visible responses. A lot of folks do this on Poll Everywhere. That might be a little dated, and I’m sure there’s something better these days. But it’s somewhere folks can constantly pop up responses and suggestions.
The biggest immediate difference that you’ll see between these approaches is the honesty. With methods that are all internal, you need to remember that you’re going to get a bit of response bias, because folks aren’t always as honest and forthcoming if they are speaking to the people that they’re talking about.
That’s one of the big benefits of working with folks like us. People have no problem telling us about you and the school experience, because we’re not in that school. So keep that in mind as you’re looking through these methods, but they’re a great way to go ahead and get started.
Let’s talk a little bit about what we have coming, because this is really where I think it changes from, “Okay, cool. I sat through one webinar, and I have some good ideas for feedback,” to, “Hey, we need to get an email out to our teachers so that they’re each attending this every month, or downloading the recording, so that throughout the year we can all be on the same page.”
This is intended for your teachers and your staff members. It isn’t just for district leadership, as far as each of these professional development sessions goes. So, Lauren, do you want to talk about them overall?
Lauren Gonzalez
As we noted, these are some of the sessions that we’re going to be discussing over the next ten months.
Each month throughout the school year, we will have a forty-five-minute PD session where we’ll dive deep into one of the dimensions of school climate. Starting out in the fall, we’ll be talking a bit more about that perception gap and how student perceptions differ from those of adults at your school, relevance of instruction, and what it means to be a trusted adult and what a trusted adult might look like at your school.
In the winter, we’re going to be taking a look at belonging and wellbeing, the physical environment and feeling safe within your school, as well as building a culture of respect, how to address student behavior, and maybe some disciplinary differences that your school and community might be facing.
And last, in the spring, we’ll be talking about leadership and trust, elevating family voice, and how to bolster your communication practices. For these sessions, we’ll be meeting monthly for about 45 minutes, discussing what we’ve learned and been seeing in the field, and providing practical guidance to support each of those capacities.
And I’ll pass it over to Kate to close us off.
Kate Popham
Thanks. Each of these will be available on demand, just like this webinar. So if you’ve got folks coming in a little late to the game, or you want a refresher, you’re always able to go back, kind of like Netflix, and binge-watch the full PD series as it’s developed.
Before we meet again, go ahead and try one of those listening methods. If you want to reach out to us about conducting any aspect of a school climate survey, from a pulse survey to focus groups to the full benchmark survey, you can scan that QR code, and that’ll take you to our website.
You’re also more than welcome to email me at kpopham@sogolytics.com. But try one listening method before next month, and see if you can identify where there may be some gaps between your staff members and students before we meet again. Watch the recording. We’ll send a one-page recap to those who have registered, so you can get a CliffsNotes version.