Introduction: The Loyalty Economy
Imagine a world where your customers aren’t just satisfied—they’re evangelists. They rave about your product to friends, defend your brand online, and stick with you even when competitors slash prices.
But in a world flooded with choices, how do you turn casual buyers into vocal advocates? Enter Net Promoter Score (NPS), a metric used by two-thirds of Fortune 1000 companies to measure one question—‘How likely are you to recommend us?’—this holds the key to predicting growth, spotting churn risks, and turning buyers into die-hard fans.
But here’s the catch: Many companies collect NPS scores, celebrate a “good” number, and miss the bigger picture. Detractors slip through the cracks, passives remain indifferent, and growth stalls.
In this guide, we’ll decode NPS, how to measure it accurately, and how to turn passive customers into promoters. Plus, we’ll share free templates and tools to help you start building a tribe of brand evangelists. Let’s dive in.
What is Net Promoter Score (NPS)?
NPS measures customer loyalty by asking one simple question: “How likely are you to recommend our company/product/service to a friend or colleague?” Respondents rate their likelihood on a 0-10 scale, categorizing them into:
- Promoters (9-10): Loyal enthusiasts who refer others.
- Passives (7-8): Satisfied but unenthusiastic customers.
- Detractors (0-6): Unhappy customers who may damage your reputation.
Calculation:

Introduced in 2003, NPS has become the gold standard for predicting growth. While CES focuses on effort and CSAT on satisfaction, NPS reveals long-term loyalty and advocacy—making it a cornerstone of customer experience (CX) strategy.
NPS vs. CES vs. CSAT: When, Why, and How to Use Each
| Metric | Measures | Best For | Limitations | How to Pair with Other Metrics |
| NPS | Likelihood of recommendation. | Gauging long-term loyalty and growth. | Doesn’t explain why customers promote or churn. | Pair with CES to uncover friction (e.g., “I’d recommend you, but returns are a hassle”). |
| CES | Effort to complete a task. | Identifying operational friction. | Doesn’t capture emotional loyalty. | Pair with NPS to see if low effort drives advocacy. |
| CSAT | Satisfaction with a transaction. | Evaluating specific interactions. | Lacks predictive power. | Pair with NPS to predict if satisfaction leads to loyalty. |
When to Combine Metrics

Pro Tip: Use Sogolytics’ CX Dashboard to visualize NPS, CES, and CSAT trends in real time.
Step-by-Step Guide:
- Survey: Send the NPS question post-purchase/support.
- Categorize: Split responses into promoters, passives, detractors.
- Calculate:
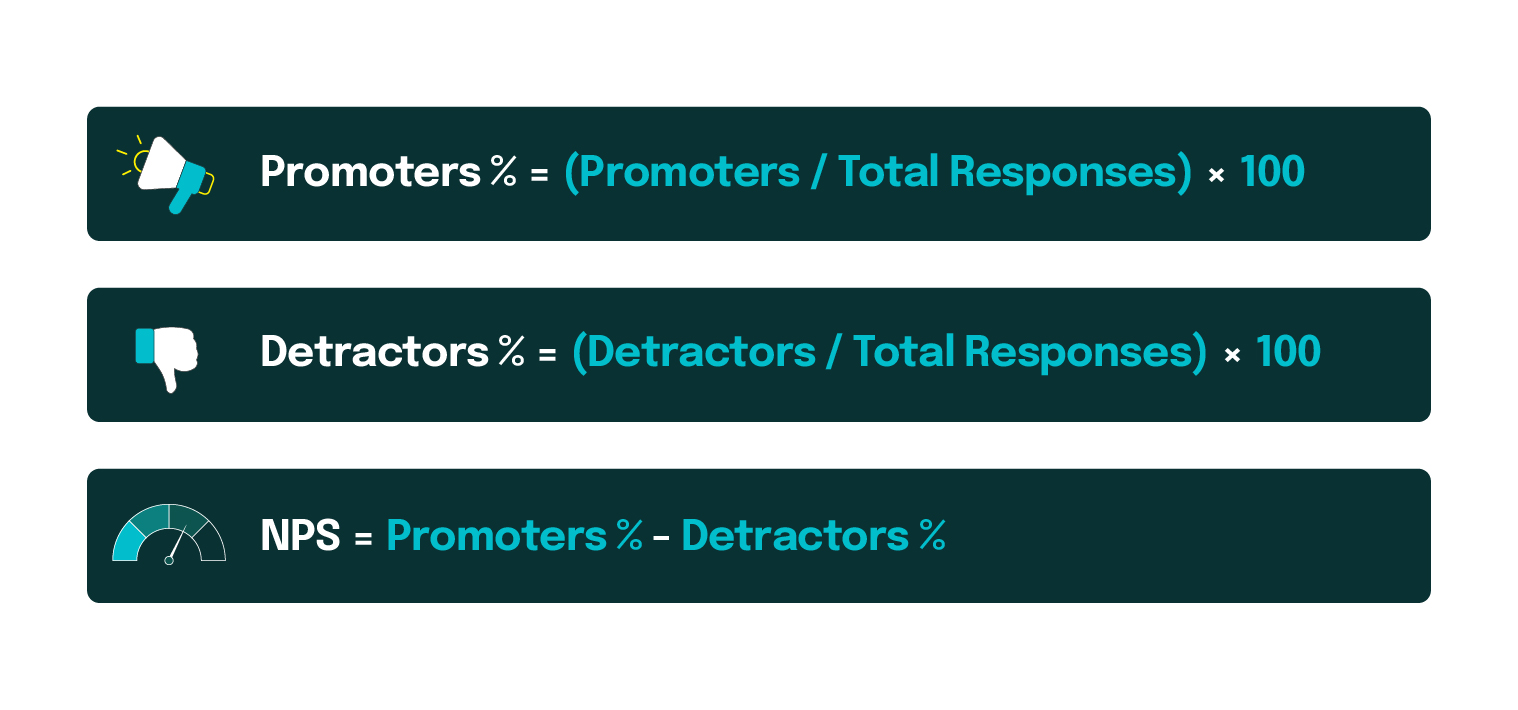
Example:
- 200 responses: 120 promoters, 40 passives, 40 detractors.
- Promoters % = 60%, Detractors % = 20% → NPS = 40.
Avoid These Mistakes:
- Ignoring Passives: Passives can tip into detractors if neglected.
- Small Samples: Ensure statistically significant response volumes.
- Biased Timing: Avoid surveying only happy customers.
Why NPS Matters: Data-Driven Insights
NPS isn’t just a number—it’s a window into your customers’ loyalty, your team’s performance, and your business’s future. Here’s why it’s a non-negotiable metric for modern brands:
1. Predicts Long-Term Growth
NPS doesn’t just measure how customers feel today—it forecasts how they’ll act tomorrow. Promoters are your unpaid sales force, driving referrals and repeat purchases. Detractors, on the other hand, quietly drain revenue through negative word-of-mouth and churn. By tracking NPS trends, you can:
- Spot loyalty leaks before customers defect to competitors.
- Prioritize improvements that directly impact retention (e.g., fixing a buggy checkout process that frustrates detractors).
- Align teams around a shared goal: turning satisfaction into advocacy.
2. Uncovers Hidden Operational Gaps
Low NPS isn’t just a “customer problem”—it’s a mirror reflecting internal inefficiencies. For example:
- If detractors complain about slow refunds, your finance team’s processes might need streamlining.
- If passives cite “lack of features,” your product roadmap may misalign with customer needs.
By linking NPS feedback to specific departments, you turn vague complaints into actionable fixes.
3. Builds a Customer-Centric Culture
NPS shifts the focus from vanity metrics (e.g., social media likes) to what truly matters: customer outcomes. Teams that regularly review NPS data:
- Develop empathy by hearing unfiltered customer voices.
- Celebrate promoters’ stories to reinforce what’s working.
- Rally around detractor recovery as a collective mission.
4. Complements Other Metrics
While CES exposes friction and CSAT measures satisfaction, NPS answers the ultimate question: “Would customers stake their reputation on your brand?” Together, these metrics paint a complete picture:
- High CSAT + Low NPS: Customers are satisfied but not loyal (e.g., they’ll switch for a cheaper price).
- Low CES + High NPS: Easy experiences fuel advocacy (e.g., one-click returns).
- Falling NPS + Rising CES: Growing friction is eroding loyalty (e.g., clunky new UI).
5. Drives Competitive Advantage
In commoditized markets, loyalty is the ultimate differentiator. Brands with industry-leading NPS:
- Command premium pricing: Customers pay more for brands they trust.
- Weather crises better: Promoters stick around during PR scandals or product recalls.
- Attract talent: Employees want to work for beloved brands.
6. Informs Strategic Decisions
NPS data isn’t just for CX teams—it’s a strategic asset for:
- Product Development: Passives’ feedback often reveals “nice-to-have” vs “must-have” features.
- Marketing: Turn promoters’ testimonials into case studies or referral campaigns.
- Leadership: Boardrooms use NPS trends to gauge brand health and ROI on CX investments.
How to Improve Your NPS Score
1. Segment & Prioritize:
Tailor your approach based on whether customers are promoters, passives, or detractors:
-
- Promoters (9-10):
- Leverage Advocacy:
- Launch referral programs with tiered rewards (e.g., “Refer 3 friends, get a free month”).
- Feature promoter testimonials in marketing campaigns or case studies.
- Keep Them Engaged:
- Offer exclusive previews of new features or products.
- Invite them to beta-testing groups to deepen their investment in your brand.
- Leverage Advocacy:
- Promoters (9-10):
-
- Passives (7-8):
- Re-Engage Strategically:
- Send personalized surveys to uncover why they’re lukewarm (e.g., “What’s holding you back from recommending us?”).
- Target them with limited-time offers or loyalty perks to tip them into promoter territory.
- Educate:
- Share tutorials or success stories showcasing underused features they might value.
- Re-Engage Strategically:
- Passives (7-8):
- Detractors (0-6):
- Immediate Recovery:
- Step 1: Apologize within 24 hours using templated but empathetic emails.
- Step 2: Diagnose the root cause (e.g., follow-up surveys or call transcripts).
- Step 3: Compensate thoughtfully (e.g., discounts, free upgrades, or priority support).
- Prevent Escalation:
- Flag detractors in your CRM to ensure no repeat issues.
- Immediate Recovery:
2. Operational Fixes:
Optimize internal processes to reduce friction and build lasting loyalty:
-
- Speed Up Resolution Times
- Smart Ticket Routing: Automatically route complex issues to specialized teams (e.g., billing queries → finance).
- Set Clear SLAs: Prioritize high-impact detractors (e.g., resolve all 0-6 scores within 48 hours).
- Automate Repetitive Tasks: Use chatbots for instant answers to FAQs (e.g., order tracking, password resets).
- Speed Up Resolution Times
-
- Empower Frontline Teams
- Autonomy Training: Equip support teams to resolve issues without escalation (e.g., refund approvals up to $100).
- Incentivize Loyalty: Tie bonuses or recognition to NPS improvements (e.g., rewards for converting detractors).
- Empower Frontline Teams
-
- Simplify Key Journeys
- Audit High-Effort Touchpoints: Map pain points in journeys like returns, cancellations, or onboarding.
- Self-Service Options: Build knowledge bases, video guides, or AI chatbots to empower customers.
- Simplify Key Journeys
- Close the Feedback Loop
- Automate Follow-Ups: Trigger personalized emails to detractors after resolution.
- Cross-Department Collaboration: Share insights with product, marketing, and leadership teams to align on fixes.
3. Advanced Tactics: Turn Insights into Growth
Go beyond basics with strategies that future-proof loyalty:
-
- Predict Churn with Trend Analysis
- Track NPS trends over time to spot loyalty erosion (e.g., dips after pricing changes).
- Pair NPS with behavioral data (e.g., login frequency, purchase history) to identify at-risk accounts.
- Predict Churn with Trend Analysis
-
- Leverage Sentiment Analysis
- Analyze open-text feedback to uncover hidden pain points (e.g., “slow app” or “poor onboarding”).
- Tag and categorize responses to prioritize fixes (e.g., 50+ complaints about checkout errors → engineering sprint).
- Leverage Sentiment Analysis
-
- Integrate with CRM for Hyper-Personalization
- Sync NPS scores with customer profiles to tailor interactions:
- Promoters: Invite to referral programs.
- Passives: Offer loyalty perks after 30 days of inactivity.
- Detractors: Assign dedicated account managers for high-value accounts.
- Sync NPS scores with customer profiles to tailor interactions:
- Integrate with CRM for Hyper-Personalization
- Benchmark Against Competitors
- Compare your NPS to industry averages to identify gaps. For eg, if X company discover that its NPS lagged 15 points behind rivals, they can analyze the major cause and work on it as a priority.
Pro Tip: Learn how to drive retention and revenue with our 10 tips to improve your NPS.
Advanced NPS Analytics: Turning Data into Strategic Insights
While your Net Promoter Score (NPS) provides a snapshot of customer loyalty, advanced analytics uncovers the why behind the score and its long-term impact on your business. Here’s how to move beyond basic metrics and transform NPS data into actionable strategies.
1. Granular Segmentation: Beyond Basic Demographics
Move beyond standard segments (age, region) to uncover hidden loyalty drivers so you can allocate resources strategically.
By Behavioral Cohorts
- Analyze NPS for power users vs. casual users, or frequent buyers vs. one-time purchasers. This reveals whether your most engaged users are truly your biggest advocates—or if they’re silently frustrated.
By Journey Stage
- Compare scores for new customers (onboarding), mid-cycle (renewal), and post-exit (win-back). A low renewal score, for instance, signals misaligned expectations or pricing friction, while a high post-churn score hints at win-back potential.
By Campaign Attribution
- Link NPS to specific marketing campaigns or product launches. Did your recent feature update boost advocacy, or did a pricing change alienate loyalists?
2. Predictive Modeling: Forecast Loyalty Shifts
Use historical NPS data to forecast future loyalty trends and deploy proactive strategies to retain at-risk customers before they churn.
Leading Indicators
- Pair NPS with behavioral data (e.g., login frequency, support tickets) to flag at-risk accounts before they churn. For instance, a passive score combined with declining usage often precedes cancellation.
Scenario Analysis
- Model how operational changes (e.g., faster shipping, price hikes) could impact loyalty. This prevents costly missteps by forecasting trade-offs between short-term gains and long-term trust.
Pro Tip: Combine NPS with customer lifetime value (CLV) models to prioritize high-impact accounts.
3. Correlation with Operational Metrics: Diagnose Systemic Issues
Link NPS to backend processes to uncover root causes. Operational data answers why scores fluctuate—so you can stop guessing and start fixing.
Support Efficiency
- Correlate NPS with first-response time, escalations, or agent handle time. If low scores spike when hold times exceed 5 minutes, you’ve pinpointed a fixable bottleneck.
Product Performance
- Map NPS to app crashes, load times, or feature adoption. A loyalty dip after a mobile app update? That’s a direct prompt for a hotfix.
4. Competitive benchmarking: Contextualize Your Score
Get answers to “Are we good enough?” and “Where should we improve first?” using benchmarking which helps you in guiding resource allocation and goal-setting.
Industry Peers
- Use third-party reports or tools to gauge your standing. Compare your NPS to sector averages to answer “Are we lagging or leading?”. A SaaS company with a score of 50 might seem strong—until they discover competitors average 65. This gap exposes blind spots, like outdated onboarding flows or missing integrations, that basic surveys might miss.
Internal Benchmarks
- Track progress against your own historical data. If your NPS improved 10 points year-over-year after revamping customer support, you’ve validated that investment. Conversely, a stagnant score signals untapped opportunities.
NPS Pitfalls to Avoid: Turn Mistakes into Momentum
Even the most well-intentioned NPS programs backfire when teams fall into these common traps. Here’s how to sidestep them—and turn missteps into loyalty-building opportunities.
1. Survey Fatigue: Respect Their Time
The Pitfall: Bombarding customers with frequent surveys leads to ignored requests, skewed data, or worse—annoyance that tanks loyalty.
The Fix:
- Time It Right: Send NPS surveys after meaningful interactions (e.g., post-purchase, post-support resolution).
- Cap Frequency: Limit surveys to 1-2 times per year for B2C or quarterly for B2B.
- Keep It Short: Pair the NPS question with 1-2 open-ended follow-ups (e.g., “What’s one thing we could do better?”).
Pro Tip: Use smart sampling to avoid surveying the same customers repeatedly.
2. Ignoring Passives: The Silent Churn Risk
The Pitfall: Focusing only on promoters and detractors while neglecting passives (7-8 scores) leaves a loyalty “gray zone” ripe for competitors to exploit.
The Fix:
- Targeted Re-Engagement: Send passives personalized offers (e.g., “Enjoy 20% off your next order as thanks for your feedback”).
- Dig Deeper: Ask passives, “What would make you a 9/10?” to uncover hidden barriers.
- Segment Smartly: Group passives by behavior (e.g., inactive users, infrequent buyers) for tailored campaigns.
3. Overreliance on NPS: Balance with Context
The Pitfall: Treating NPS as a standalone metric leads to blind spots. For instance, a high NPS won’t explain why customers love you—or warn you if effort (CES) or satisfaction (CSAT) is slipping.
The Fix:
- Pair with CES: Use Customer Effort Score to diagnose why detractors are frustrated (e.g., “Returns took 3 steps” vs. “Returns were slow”).
- Layer with CSAT: Measure transactional satisfaction (e.g., “How happy were you with today’s support?”) to pinpoint immediate fixes.
- Triangulate Data: A high NPS + low CES = effortless advocacy. A low NPS + high CSAT = loyalty gaps despite satisfaction.
Conclusion
Building customer loyalty isn’t just a goal—it’s a growth engine. Net Promoter Score (NPS) empowers businesses to identify advocates, address hidden risks, and prioritize improvements that turn satisfied customers into lifelong promoters. By actively analyzing NPS trends and acting on feedback, companies can amplify retention, reduce churn, and unlock sustainable revenue.
Ready to elevate your Net Promoter Score? Talk to our experts today to start measuring—and mastering—customer loyalty.
FAQs
Q1: How often should I send NPS surveys?
A: To avoid survey fatigue, limit surveys to 1-2 times per year for B2C audiences and quarterly for B2B. Time surveys after meaningful interactions, like post-purchase or post-support interactions, to boost response rates. Use smart sampling to ensure you’re not over-surveying the same customers, which can skew data and frustrate loyal users.
Q2: What do I do with NPS feedback from detractors?
A: Detractors (0-6 scores) require urgent action to prevent churn. Start with a personalized apology and resolve their issue within 48 hours. Offer compensation, like discounts or priority support, to rebuild trust. Flag detractors in your CRM to ensure follow-ups and prevent repeat issues. Use their feedback to identify systemic problems—like slow refunds or poor onboarding—and address them operationally.
Q3: How do I convert passive customers into promoters?
A: Passive customers (7-8 scores) need targeted nurturing to tip them into promoter territory. Start with personalized offers, such as loyalty discounts or early access to new features. Follow up with a survey asking, “What would make you a 9/10?” to uncover hidden barriers. Additionally, share tutorials or case studies showcasing underused features they might value, turning indifference into enthusiasm.
Q4: How can I use NPS to reduce churn?
A: Combine NPS trends with behavioral data (e.g., login frequency, purchase history) to predict churn. For example, passives with declining activity are high-risk—launch win-back campaigns like exclusive offers or personalized check-ins. Address recurring pain points flagged by detractors, such as billing errors or poor UX, to prevent future loyalty leaks.
Q5: What tools can help me track and analyze NPS effectively?
A: Look for platforms offering NPS survey templates, automated workflows, and real-time dashboards. Key features include sentiment analysis to categorize open-text feedback, CRM integrations to tag promoters/detractors, and benchmarking tools to compare scores against industry standards. These tools streamline data collection, prioritize actionable insights, and help teams act on feedback faster.